My Trading Game Plan Revealed - 04/24/2026: Semiconductor Bubble Warning as Nasdaq Nears 25,000

Markets are confronting a fascinating dichotomy, caught between geopolitical tensions and an absolute bullish frenzy in the technology sector. As the broader market struggles for direction, the semiconductor space is experiencing a historic, parabolic run that has seasoned professionals drawing direct comparisons to the most infamous market bubbles in history. In this morning's My Trading Game Plan show, Gareth Soloway, Chief Market Strategist at Verified Investing, provided a masterclass on navigating these treacherous waters, breaking down the psychological extremes, technical extensions, and intermarket relationships that every trader needs to understand.
This article expands on the critical themes discussed in today's broadcast, offering historical context and deeper technical analysis to help investors separate logic from hype in an increasingly irrational market environment.
The Semiconductor Surge: Rational Growth or Dot-Com 2.0?
The focal point of today's market action is undeniably the semiconductor sector, spearheaded by Intel's astonishing post-earnings surge. After reporting earnings that included a modest $0.29 per share, Intel's stock gapped up massively, trading up 49% to 50% in the pre-market before settling into a 25% gain during regular hours. This move has pushed Intel toward a staggering $400 billion valuation.
To put this into perspective, we must look at the underlying fundamentals versus the price action. Intel is currently trading at a forward PE ratio of approximately 100. While the company handily beat estimates, a valuation of this magnitude prices in absolute perfection for years to come—assuming demand never wanes and margins never compress.
Gareth addressed the elephant in the room directly: "Is it a bubble? Absolutely. Do we know when it's going to end? We do not. That's the way bubbles work. When it ends, it'll be nasty…"
The broader semiconductor index (SOXX) reflects this unprecedented exuberance. The index gapped higher today, marking its 18th consecutive up day. In the world of technical analysis and probability-based trading, an 18-day winning streak in a major sector index is a statistical anomaly of the highest order. The SOXX has blown through nearly every historical trendline, leaving only one vertical resistance level remaining between $458 and $460.
With Nvidia boasting a 5 trillion valuation and Broadcom reaching 2 trillion, the sheer amount of capital concentrated in this single sector is staggering. The critical lesson for traders here is that recognizing a bubble and shorting a bubble are two entirely different disciplines. Markets can remain irrational far longer than most traders can remain solvent, which is why strict adherence to technical levels—like the $458 to $460 zone on the SOXX—is paramount.
The Mechanics of Capitalism: Competition and Margin Compression
One of the most intriguing divergences in today's tape is the price action of Nvidia. Despite the massive gap up in the SOXX and Intel's 25% surge, Nvidia opened flat to negative and struggled to catch a bid.
Why would the undisputed king of the AI chip revolution sit out of a sector-wide rally? The answer lies in the fundamental mechanics of capitalism: competition.
As Gareth noted, companies like ARM Holdings and Marvell Technology (MRVL) are aggressively developing competing chips. ARM has seen its stock price explode by 100% since March 9th, while Marvell has similarly surged 100% from $86 since March 30th. As these companies, along with a revitalized Intel, bring alternative products to market, the inevitable result is a price war.
Historical precedent provides a sobering warning for current semiconductor investors. Gareth drew a brilliant parallel to the solar energy boom of 2006 to 2007. During that era, companies like First Solar were viewed as the undeniable future of energy. First Solar's stock skyrocketed from $2 to $300 over a couple of years. The narrative was flawless—until international competition, specifically from China, flooded the market with cheap solar panels. Margins collapsed overnight, and the stocks subsequently plummeted by 80%.
When a sector becomes this lucrative, it attracts massive capital investment from competitors. Eventually, supply catches up with demand, pricing power evaporates, and the astronomical PE ratios can no longer be justified. Nvidia's sluggishness today may be the market's early recognition that the moat is beginning to shrink.
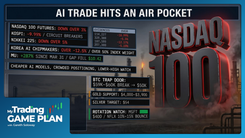
The NASDAQ's Historical Echo: Approaching 25,000
Perhaps the most chilling and fascinating analysis from today's show involved the macro timeline of the NASDAQ composite. Technical analysis isn't just about drawing lines on a chart; it's about understanding market cycles, human psychology, and historical symmetry.
During the climax of the dot-com bubble in the year 2000, the NASDAQ experienced a vertical, blow-off top, surging from 4,000 to peak just above 5,000. Following that peak, the index entered a brutal bear market and did not see those highs again for 15 years.
Fast forward to the year 2026. We are roughly 25 years removed from the dot-com peak. If you apply a multiple of 5 to that historic 5,000 top, you arrive at 25,000. Today, the NASDAQ is rapidly approaching that exact 25,000 level.
"Is the NASDAQ on the verge of a 15-year top? People will say I'm crazy. I'm used to that. That's okay. I just look at these things, and I look at the cycles, and I look at the charts," Gareth explained.
While it is impossible to predict the exact top to the penny, the confluence of a 25-year cycle, a 5x multiple of a historic bubble peak, and the current parabolic price action in the index's heaviest weightings (semiconductors) creates a compelling case for extreme caution. When the NASDAQ tags 25,000, it will represent a monumental psychological and technical milestone that savvy investors will monitor closely for reversal signals.
The S&P 500 vs. Oil: An Inverse Dance
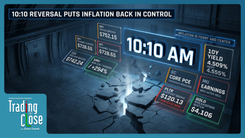
While the NASDAQ flies high on tech exuberance, the S&P 500 is painting a much more complex picture, acting as a battleground between equity bulls and commodity-driven inflation fears. The broader market is currently trading in an almost tick-for-tick inverse relationship with crude oil.
This dynamic was on full display over the last 24 hours. When news broke that a major diplomat from Iran was traveling to Islamabad for negotiations, oil prices immediately plummeted by $4. As oil dropped, S&P futures surged. However, as the market digested the news and oil bounced back above the critical $90 level, the S&P futures faded in tandem.
This inverse relationship is crucial for day traders and swing traders to understand. When oil sustains levels above $90 per barrel, it acts as a direct tax on the consumer and reignites fears of sticky inflation, which in turn pressures the Federal Reserve to maintain restrictive monetary policy.
From a technical standpoint, oil has formed a chart pattern that suggests further upside. The recent pullback to the "scene of the crime" (previous breakout levels) has set the stage for a potential run toward $100, or even $104 per barrel. If oil executes this technical move, the headwinds for the S&P 500 will intensify significantly, potentially dragging the broader market down even if tech attempts to hold the line.
Gold, Silver, and the Shifting Safe Haven Narrative
The precious metals market is currently exhibiting behavior that should raise eyebrows for long-term macro investors. Despite the geopolitical uncertainties in the Middle East and the looming threat of inflation, gold is trading flat to slightly lower, showing signs of rolling over.
More concerning than the price action itself is the context of the price action. Historically, gold serves as a safe-haven asset, moving inversely to risk-on assets like high-growth equities. However, recently, gold has decoupled from this 1,000-year historical norm.
As Gareth astutely pointed out, retail investors are suffering from a severe case of FOMO (Fear Of Missing Out). When a retail trader sees Intel gapping up 25% or ARM Holdings doubling in six weeks, the slow, steady preservation of wealth offered by gold becomes unappealing. Capital is being drained from traditional safe havens and poured into the semiconductor casino.
For long-term gold advocates, this decoupling is actually a necessary reset. Gold needs to flush out the speculative hot money and return to its traditional role.
Silver, meanwhile, remains flat on the day after a beautiful technical hit of $82. Traders should keep a close eye on the $66 to $64 level as a potential downside target and support zone if the metals complex continues to consolidate.
Bitcoin: A Macro Bear Flag in the Making
Cryptocurrency traders are also facing a critical juncture. Bitcoin recently pushed up and "kissed" the $79.5K level, coming within a hair of the $80K target Gareth had previously outlined. However, the technical landscape has shifted, prompting a downgrade from bullish to neutral.
The primary concern for Bitcoin isn't just its own chart, but its correlation to the heavily extended equity markets. Bitcoin has increasingly traded as a high-beta risk asset. If the NASDAQ and S&P 500 are approaching major cyclical tops, Bitcoin is highly vulnerable to the resulting liquidity drain.
Furthermore, Bitcoin is currently carving out a macro bear flag pattern. While there is a minimal risk-reward case for a final push to $80K or perhaps $85K in a best-case scenario, the broader technical structure suggests that the upside is capped. Professional traders do not risk capital for minimal upside when a macro bearish pattern is looming; they wait for high-probability setups to emerge.
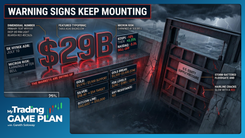
The Psychology of Extremes: Fear, Greed, and Smart Money
To truly understand the current market environment, we must look beyond the charts and examine the underlying psychology. Gareth revealed that his proprietary internet psychology scan generated a 99 on the Fear and Greed index this morning.
A reading of 99 is an absolute extreme. It indicates a market completely devoid of fear, where participants believe prices can only go up. Historically, readings at this level are major proprietary signals of an impending, violent reversal. When everyone is on one side of the boat, it takes very little to tip it over.
Adding fuel to this contrarian fire are reports regarding smart money flows. The massive run in data center and AI infrastructure stocks has been heavily supported by Middle Eastern sovereign wealth funds and institutional capital. However, data suggests these entities are beginning to pull back on their spending. If the smart money is quietly exiting the building while retail investors are aggressively buying the 18th consecutive up day in the semiconductor index, the stage is set for a classic wealth transfer.
We have seen this movie before. Look at the recent collapse of CAR (Avis Budget Group), which plummeted from $860 down to $200 in a matter of two days. When a heavily extended, crowded trade finally breaks, the exit door is never large enough for everyone to get out.
Conclusion: Logic Over Hype
As we navigate this wishy-washy broader market and the parabolic tech bubble, the principles taught at Verified Investing have never been more critical. Logic and charts must beat hype and narratives every single time.
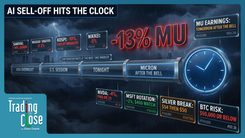
Next week promises to be a monumental test for these extended markets, with a deluge of economic data and mega-cap tech earnings on the horizon, including reports from Apple, Meta, and Microsoft. These reports will either provide the fundamental justification needed to sustain these historic valuations, or they will be the catalyst that finally breaks the semiconductor fever.
For traders, the game plan remains steadfast: do not chase vertical moves. Respect the historical cycles, monitor the inverse relationship between oil and equities, and wait patiently for price to reach your predefined technical levels. Whether it's watching the SOXX at the $458 to $460 resistance, waiting for Intel to potentially fade below $80 from its all-time high of $76, or monitoring the NASDAQ's approach to 25,000, discipline is your ultimate edge.
By removing emotion, ignoring the FOMO, and relying strictly on probability-based technical analysis, investors can protect their capital during bubble conditions and position themselves to profit when the inevitable reversion to the mean occurs.
Trading involves substantial risk. All content is for educational purposes only and should not be considered financial advice or recommendations to buy or sell any asset. Read full terms of service.