My Trading Game Plan Revealed - 05/19/2026: Semiconductor 40% Risk as Rising Yields and Oil Pressure Markets

The financial markets are currently navigating a treacherous intersection of geopolitical tension, shifting macroeconomic data, and stretched technical valuations. As investors grapple with the push and pull of global events, the need for objective, chart-based analysis has never been more critical. In this morning's My Trading Game Plan show, Gareth Soloway, Chief Market Strategist at VerifiedInvesting.com, provided a masterclass on how to tune out the noise and focus on the data.
As Gareth frequently reminds his viewers, "Logic and charts beat hype and narratives every time." Today's article expands on the critical technical setups, macroeconomic pressures, and historical market fractals discussed in the show, providing traders with the comprehensive context needed to navigate the days ahead.
The Macro Pressure Cooker: Yields, Oil, and Geopolitics
The broader market environment is currently being dictated by two massive macro forces: the 10-year Treasury yield and crude oil prices. Understanding the relationship between these assets and equity valuations is fundamental to successful trading in the current cycle.
The 10-year yield has continued its relentless push upward, hitting 4.627% and subsequently ticking up to 4.631% during the morning session. This is a vital metric for equity traders to monitor. As yields rise, the cost of capital increases, which places immediate downward pressure on corporate valuations—particularly for long-duration growth and technology stocks. When the risk-free rate of return becomes more attractive, the stock market must adjust its risk premium accordingly.
Simultaneously, the geopolitical landscape is heavily influencing energy markets. Yesterday afternoon, oil prices were surging amid fears of a resumed US tax or strike on Iran. However, a late-day Truth Social post from the President, indicating that Middle Eastern leaders had requested the US not to reignite strikes, caused oil to pull back sharply into the close. This temporary relief in oil prices gave the S&P 500 futures a much-needed, albeit small, bounce.
Despite this brief reprieve, the technical setup on crude oil remains highly precarious. Oil is currently consolidating within a tight wedge pattern. The Strait of Hormuz remains closed, and as long as this critical global shipping artery is restricted, the pressure on the US economy mounts.
From a technical perspective, if oil registers a daily close above its current wedge trend line, it triggers a high-probability breakout setup. The measured target for this move would be a dramatic spike back to $115 to $120 per barrel. A surge of this magnitude would act as a massive tax on the consumer, rapidly accelerating the inflation data that has already been running hot over the last two months.
Gareth highlighted a crucial nuance regarding why these macro indicators move, which dictates how the stock market will react:
"If yields are falling because the economy is cracking and we're going into a recession, if oil is falling because demand destruction is occurring because we're going into recession, that's not good for the stock market because it hurts corporate profits. If oil is pulling back because all of a sudden the Strait of Hormuz is open and oil just pulls back because we have more supply hitting the market, that is good for the stock market."
This distinction is the essence of professional market analysis. Context matters just as much as the price action itself.
The S&P 500 and NASDAQ at a Crossroads
When we zoom out to the daily charts, the broader equity indices are showing signs of exhaustion after historic runs. The S&P 500 has experienced a massive overall move since the October 2023 lows. Along the way, we witnessed sharp, narrative-driven corrections—first on tariff concerns, and later on the Strait of Hormuz disruptions—but the index has persistently clawed its way back near all-time highs.
However, the S&P 500 is now interacting with a critical short-term resistance trend line that connects the high pivot prior to the tariff sell-off with the most recent surge. There is clear historical precedence for the market to face a significant pullback from these levels.
The NASDAQ paints an even more extreme picture. The tech-heavy index has run an astonishing 30% off its late March lows. On the QQQ chart, price action has tagged a long-term trend line dating back to the 2018 through 2021 bull market highs, as well as a secondary trend line connecting the July 2023 and July 2024 highs.
While the "buy the dip" mentality remains prevalent—evidenced by the long bottom tails on recent daily candles—the critical question is how much dry powder institutions have left to deploy. The market is looking increasingly tired, and the cracks are beginning to show in the very sector that has carried the indices higher: semiconductors.
The Semiconductor Cycle: A Historical Warning
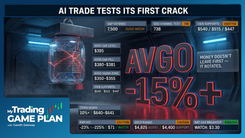
Perhaps the most eye-opening segment of today's analysis was the deep dive into the semiconductor sector. The semiconductor SMH ETF is exhibiting a historical fractal pattern that should have every tech investor on high alert.
By measuring the structural moves of the SMH ETF, a shocking similarity emerges. The bull market run from the COVID lows to the 2021 peak was a 240% move. Following the subsequent bear market low, the next bull run was exactly 240%. And from the most recent low to the recent high? A significant multi-year run that mirrors the prior cycles.
In technical analysis, when an asset repeats exact percentage moves across multiple cycles, it signals a structural rhythm to the buying and selling pressure. But what happens after these major runs? Following the 2021 peak, the SMH suffered a 47% pullback. The subsequent cycle saw a 40% pullback. If this historical rhythm holds true, the SMH is currently on the verge of at least a 40% correction.
We are already seeing the leading edges of this breakdown. Intel has pulled back approximately 18%. Micron experienced a mammoth fall yesterday and is trading down again today at $664, with technical downside targets pointing toward a retrace to the $450 to $460 level.
The psychological setup in the semiconductor space is equally dangerous. Hedge funds currently have their highest exposure to semiconductors in history. When the herd is entirely on one side of the boat, the risk of a violent capsizing increases exponentially. If these funds are forced to unwind even half of their positions to return to long-term alignment, the resulting liquidity vacuum could easily trigger the 40% to 50% drawdowns that the historical SMH fractal suggests.
The P/E Compression Trap: Sandisk
Gareth's analysis of Sandisk provided a perfect real-world example of how fundamental metrics can trap retail investors at the top of a cycle. Sandisk is currently pulling back to around $1,300, which represents approximately 17% off its 52-week highs.
To the untrained eye, Sandisk looks like an incredible value, trading at a forward Price-to-Earnings (P/E) ratio of approximately 24x. However, memory chips are not a proprietary technology. Because current margins are astronomically high, every tech manufacturer in China is rushing to produce memory chips. This incoming supply glut will inevitably crash profit margins.
As Gareth explained, a P/E of 10 at the top of a cyclical boom is an illusion. As earnings collapse, that P/E ratio will rapidly expand to 15, 30, 50, and eventually 100 over the next year or two, even as the stock price falls. In the semiconductor industry, stocks are often the most dangerous when their P/E ratios look the cheapest, and they are usually the best buys when their P/E ratios look astronomically high at the bottom of a bear market.
Earnings Season and Retail Health
As we navigate this technical minefield, we are also in the thick of retail earnings, which provide a direct pulse on the health of the consumer. Home Depot reported earnings this morning, resulting in a fractional move higher as the stock responded positively to the beat on both EPS and revenue estimates.
While Home Depot's beat reinforces near-term consumer resilience, the broader concern remains: retail sales are under pressure, and higher borrowing costs continue to weigh on the consumer.
The market's focus now shifts to Target's earnings tomorrow, and Walmart's report on Thursday. While Walmart caters to a more defensive, necessity-driven consumer base, these reports will be critical pieces of the macroeconomic puzzle. Of course, the undisputed main event of the week will be Nvidia's earnings report tomorrow after the bell, which has the potential to either single-handedly save the semiconductor sector or act as the catalyst that triggers the 40% SMH pullback.
Cybersecurity Strength and Overextended Setups
While the semiconductor space shows signs of structural breakdown, strength has rotated into the cybersecurity sector. However, professional traders know that strength does not automatically equate to a buying opportunity. In fact, extreme strength often provides the best short-selling setups.
Palo Alto Networks has been on a relentless upward trajectory, but it is rapidly approaching a massive long-term trend line resistance near $255. Given the high extension of this move and the sheer number of consecutive up days, $255 represents a high-probability swing trade short opportunity.
Similarly, CrowdStrike is pushing toward a beautiful, multi-point trend line resistance right around $635. While the stock was trading marginally lower this morning, any push into that $635 level offers a compelling technical area to monitor for a top.
With the Relative Strength Index (RSI) on these cybersecurity names nearing 90—a level indicating extreme overbought conditions—the rubber band is stretched to its absolute limit. The discipline here is patience. Rather than chasing the momentum, professional traders map out these extreme levels in advance and wait for the price to come to them.
Commodities and Crypto: Key Technical Levels
The technical setups across commodities and cryptocurrency are equally compelling, offering clear lines in the sand for traders.
Natural Gas: The patience of commodity traders is being rewarded, as Natural Gas has ground higher, up about 20% from its recent lows. The asset is steadily approaching Gareth's first target number, where risk-reward metrics will begin to shift, making it an ideal zone to scale out and lock in profits.
Gold: The precious metal is currently testing the resolve of bulls. Gold is clinging to a minor, short-term technical support level. The line in the sand is clear: if gold registers a daily close below $4,500, the technical floor falls out. A break of this level opens the trapdoor for a move down to $4,300, with a longer-term structural target of $3,900.
Silver: Silver is exhibiting a classic ascending trend line. Yesterday, buyers stepped in to defend this exact line. However, if the daily candle closes below this trend line, the technical damage will be done, projecting a swift move down to $71, and potentially sliding further into the $66 to $64 range.
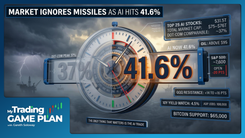
Bitcoin: The cryptocurrency market is experiencing a significant cooling-off period. After calling the rally up to the $83,000 resistance level, Gareth has watched Bitcoin pull back steadily, dropping below $77,000 amid a string of consecutive down days.
The entire crypto market is now watching one specific trend line sitting at $71,500. This is the ultimate pivot point. If $71,500 holds, Bitcoin has the technical footing to bounce. But if that trend line breaks, the technical void below is massive. A breakdown would target $60,000, with a very real possibility of testing the $50,000 level.
Conclusion: The Discipline of the Chart
As we look across the landscape of equities, commodities, and crypto, a singular theme emerges: the market is at a critical juncture. From the S&P 500 testing resistance and the SMH ETF threatening a historical 40% correction, to oil coiling in a wedge and Bitcoin teetering on major support, the next directional moves will define the remainder of the quarter.
In environments like this, retail investors often fall victim to emotional trading, chasing green candles in cybersecurity or panic-selling red candles in semiconductors. The antidote to this emotional turbulence is the strict, unwavering discipline of technical analysis.
By understanding the macroeconomic forces of the 10-year yield and oil, recognizing historical fractals in the tech sector, and mapping out precise levels for assets like gold and Bitcoin, traders can remove the guesswork from their strategy. The charts provide the roadmap; it is up to the individual trader to have the discipline to follow it.
As the week unfolds with crucial retail earnings and the highly anticipated Nvidia report, remember to trust the data, respect your levels, and never let the narrative override the chart.
Trading involves substantial risk. All content is for educational purposes only and should not be considered financial advice or recommendations to buy or sell any asset. Read full terms of service.