My Trading Game Plan Revealed - 05/28/2026: Data-Fueled Rally, Semiconductor Reversal, Snowflake Short Squeeze and Bitcoin Make-or-Break

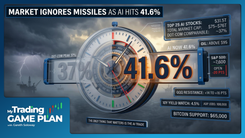
Overnight futures dropped on reports of direct US-Iran military exchange. By morning open, the market had shrugged it off entirely and was pushing higher. The catalyst was PCE data — April headline inflation came in at 3.8% year-over-year, matching estimates exactly, but marking the highest reading in nearly three years. Core PCE hit 3.3% annually, also in line. Durable goods orders printed positively. Yields dropped. Futures recovered.
For traders trying to make sense of a market that rallies on a three-year inflation high while ignoring active military conflict, Gareth's framing cuts through the noise:
"If the markets like them and the markets go up on them, then that's all that matters to real traders and investors."
Price action is the arbiter. Arguing with the market's reaction destroys accounts. The charts said rally. That is the trade.
But underneath the recovery, two charts are telling a more complicated story — and both need to be watched before the broader bullish thesis can be trusted.
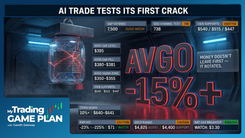
MRVL: What a Reversal Engulfing Candle Actually Means
Marvell Technology reported earnings after the close on May 27. The stock had been trading around $199 heading into the print. Pre-market on May 28, it was trading in the $200–206 range — a modest bounce on what looked like a solid beat.
The daily chart tells a different story.
MRVL printed a reversal engulfing candle on its earnings reaction. This pattern forms when a stock opens above the prior day's high but faces enough selling pressure to close below the prior day's low. It represents a complete transfer of control from buyers to sellers in a single session — one of the strongest single-candle reversal signals in technical analysis.
Because that pattern is now on the chart, any bounce is treated with skepticism. The setup offers strong risk-to-reward for a short: entry on the bounce near the pre-market highs, stop just above the high of the engulfing candle, with meaningful downside potential if the pattern plays out. The risk is defined. The reward is asymmetric. That is the setup.
This matters beyond MRVL itself. The semiconductor sector has been the primary driver of this entire market rally. A confirmed reversal signal in a major semiconductor bellwether — while the broader index grinds higher — is exactly the kind of internal divergence that precedes a broader shift. It does not mean the shift is here. It means the setup is worth monitoring closely.
"Is the market overbought? Absolutely. Are valuations stretched? Absolutely. Is the CapEx spending from AI probably the only thing that's keeping GDP positive? Absolutely."
The trend is intact until it isn't. Topping tails and reversal engulfing candles are how it starts to look different.
Snowflake and the Software Squeeze: What Actually Happened
The cloud software sector has been one of the most heavily shorted areas of the market. Beaten down, structurally lagging semiconductors, and facing questions about whether AI is displacing SaaS spending rather than expanding it.
Snowflake just answered that question — loudly.
The company had fallen from a 52-week high near $280 down to around $118 before stabilizing. After the close on May 27, Snowflake reported Q1 results that beat estimates by a wide margin, with EPS of $0.39 against an estimate of $0.14. Alongside the earnings, the company announced a $6 billion infrastructure partnership with Amazon Web Services. The stock surged approximately 33–35% on May 28 — its best single day on record.
This was not purely a short squeeze. The scale of the earnings beat and the AWS deal size triggered genuine re-rating across the entire cloud and cybersecurity sector. ZScaler, which had dropped sharply on its own guidance the prior session, is now a candidate for a sympathy bounce back toward the $130 area. MongoDB caught a massive pre-market bid on Snowflake's strength before reporting its own numbers. CrowdStrike, sitting at all-time highs, caught the updraft as well.
For traders eyeing Snowflake specifically after the gap, the setup is not to chase. The pattern-based approach is to identify levels — Gareth flagged potential day trade short levels on the gap for traders looking to fade the initial euphoria, not join it.
The broader message from Snowflake's move is structural: enterprise AI adoption is accelerating at the data layer, not just the chip layer. That is a read-through for the entire software sector that has been left behind while semiconductors ran. Whether this is a rotation or the beginning of a broader software recovery depends on what MongoDB and the next wave of SaaS earnings confirm.
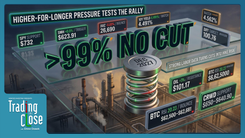
Bitcoin: The Most Important Chart in the Market Right Now
Bitcoin hit Gareth's previously identified parallel channel target near the $80,000–$85,000 range at the top of the structure. The rejection was sharp. The cryptocurrency has since traversed to the low end of that same channel — and is now sitting exactly on the lower trend line support.
On May 28, Bitcoin dropped below $75,000, trading in the $72,000–$73,000 range. That is the level.
"This trend line must hold."
If Bitcoin registers confirmed daily closes below this support, the recent price action shifts classification from consolidation to bear flag. The technical measured move of a bear flag breakdown at this scale has a target of approximately $60,000 — the next major structural support level.
This is not a crypto-specific concern. Bitcoin has consistently acted as a leading indicator for broader risk appetite. When Bitcoin breaks down ahead of equity markets, it is often signaling a liquidity crunch that equities have not yet priced in. The two-day divergence — equities near all-time highs while Bitcoin tests critical support — is the same type of intermarket warning that appeared in the precious metals breakdown covered earlier this week.
The trend line holds or it doesn't. Everything else in the macro picture flows from that resolution.
The Position Sizing Principle
The setups discussed today — MRVL short on the bounce, Snowflake day trade fade, Bitcoin trend line watch — are only useful with the right execution framework.
"Remember, you could win 80% of the time, still means two times out of every 10, you're dead wrong. That's just the way it is."
Even the highest-probability setup fails 20% of the time. The defense is position sizing. Starting with small share size and scaling into predetermined levels means no single trade — however convincing the setup — can do structural damage to the account.
"It's like as soon as the market knows you're all in and leveraged, the market senses it, it smells it, and it just crushes you."
The setup is the easy part. The execution discipline is what separates the traders who compound from the ones who blow up on their best ideas.
What to Watch
- MRVL bounce levels — The reversal engulfing candle is on the chart. Any rally back toward the pre-market highs is the short setup. Stop above the engulfing candle's high. The pattern is active until price reclaims and closes above that level.
- Bitcoin $73,000 — The line in the sand. Confirmed daily closes below it activate the bear flag thesis and open the path toward $60,000. This is the number that matters most in the macro picture right now.
- Software sector follow-through — Snowflake's 35% move on an earnings beat and the AWS deal is the signal. Watch MongoDB's after-hours reaction and ZScaler's recovery attempt toward $130. If the sector confirms a rotation, it changes the composition of the rally significantly.
- PCE and yields — April core PCE at 3.3% YoY matched estimates but is at its highest since October 2023. Headline PCE at 3.8% is the highest since May 2023. The market rallied on "in line" — but these are not low numbers. Watch how yields respond through the rest of the session and whether the morning bid holds into the close.
- MRVL as semiconductor proxy — If MRVL's reversal engulfing confirms and the stock rolls over, watch whether the broader SMH follows. That is the sequence that matters for the index-level bull case.
Trading involves substantial risk. All content is for educational purposes only and should not be considered financial advice or recommendations to buy or sell any asset. Read full terms of service.