My Trading Game Plan Revealed - 06/01/2026: Sector Rotation Sparks Chip Euphoria, Intel Selloff and Gold Breakout Risk

The major indices are sitting near all-time highs, but the action underneath the surface is far less stable than the headlines suggest. Semiconductors are euphoric, software is catching rotation, Intel is breaking down, Bitcoin is diverging from equities, oil is being held down by unusual supply dynamics, and gold is compressing between major moving averages. This is not a simple risk-on market. It is a market of extremes.
In this morning's My Trading Game Plan Revealed, Gareth Soloway, Chief Market Strategist at Verified Investing, walked through the charts to map what's actually happening beneath the index-level calm—and where the highest-probability setups are forming for the week ahead.
Semiconductor Euphoria and Software Rotation
The technology sector is undergoing a significant internal shift, catalyzed in part by a major conference in Taiwan. Gareth framed the week's Taiwan conference news as a direct competitive threat to Intel and AMD, with Nvidia expanding deeper into CPU and AI chip territory. While Nvidia caught a bid on the development, its competitors took a meaningful hit.
But the larger story, in Gareth's view, isn't the single announcement—it's the capital rotation playing out beneath the surface.
"I'm expecting, again, generally semiconductor chip stocks to start to fade a little bit as money is pulled out, moving into the software sector," Gareth noted during the broadcast.
This is a classic market mechanism: when one sector becomes historically overextended, professional money begins taking profits and reallocating into beaten-down or lagging areas. That rotation is now visibly flowing into software and data center names.
Oracle and Microsoft are pushing higher, with Microsoft forming what Gareth described as a clean bull flag pattern over Thursday and Friday. For day traders, Microsoft presents a compelling setup if it fills its gap near the $481 level. IBM has also experienced a massive move, forming a double top on the daily chart. Zooming out to the weekly chart and connecting the bull market high of 2012—when IBM ran from $66 to $200—to the high of November 2025, a critical technical resistance level emerges near $232.
ARM and the RSI Anomaly
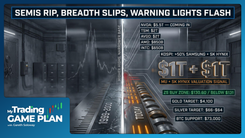
While Intel faces deteriorating technicals, other chip names have entered a zone of extreme momentum that defies conventional risk frameworks. ARM is the prime example.
Following a chip announcement at the Taiwan conference, ARM popped 10%, pushing into territory Gareth described as a market cap that had roughly doubled in just two weeks. The stock's parabolic run in May alone has been staggering by any historical measure.
That move has pushed technical indicators to rarely seen extremes.
"I mean, some of these, by the way, some of these chip stocks have monthly RSIs at 98 and 99," Gareth emphasized. "I don't know if I've ever seen that in my trading career. That's about as overbought on an RSI as you can get because it only goes up to 100."
When an RSI reaches the high 90s on a monthly timeframe, it signals a market driven by momentum and FOMO rather than fundamentals. Professional traders exercise extreme caution in this environment—neither chasing extended moves nor stepping in front of them prematurely.
Intel's Breakdown Warning Came Before the News
One of the most important technical lessons is that price action often precedes the news. The charts frequently reveal what is coming before the public catalyst explains it. The recent price action in Intel is a textbook example.
On Friday, before the Taiwan conference developments became widely known, Intel experienced a sharp selloff in the final 10 minutes of the trading session.
"I will say this is that the Intel sell on Friday and then the drop today on that news. Very suspect," Gareth observed.
The timing of Friday's late-session decline is exactly why traders are trained to respect unusual price action before the news catches up to it. When a stock closes near its lows on a day when the broader NASDAQ is at all-time highs, traders should treat that relative weakness as a warning, not a coincidence.
From a technical standpoint, Intel is now hanging by a thread. If it takes out its recent low, it establishes a confirmed downtrend. Gareth identified significant gap risk to the downside if the breakdown accelerates.
This serves as a reminder for every trader: when a name shows this kind of relative weakness against a strong tape, respect it. Don't explain it away.
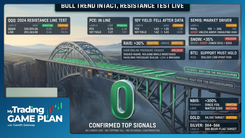
Index Technicals: Walking the Tightrope
Despite the underlying volatility, the broader market indices are maintaining their bullish posture—though the structure is precise.
The S&P 500 futures established a critical trendline near 7606 through the overnight session. A break below that level could send the index negative for the day. On the daily chart, the S&P 500 has been tracking a vital trendline connecting the March 30th low, essentially hopping along that line since May 19th. As long as the index holds above this trendline, the bullish bias remains intact. A daily close below 7560 would trigger a potential breakdown signal.
The NASDAQ 100 (QQQ), now up roughly 30% from its lows, shows a similar structure. A break below 730 would signal the risk of a larger systemic drawdown.
Looming over equities is the bond market. The 10-year Treasury yield continues to trade below the critical 4.50% level—the market's current line in the sand. As long as yields stay below that threshold, equities feel safe pressing higher. The macro backdrop remains a long-term concern, with the U.S. government now facing $1.2 trillion in annual interest payments—a number that will only grow as old debt is refinanced at current rates.
Oil, Supply Dynamics, and Geopolitical Risk
The commodity markets are telling a counterintuitive story. Over the weekend, the U.S. and Iran exchanged missile fire—an event that historically would have sent energy markets into a significant rally.
Instead, crude oil (WTI) saw only a modest intraday bounce from around $89.50 to $91.50, roughly 2.3%. The broader trend has actually been bearish, with oil suffering seven consecutive down days after breaking down from a major wedge pattern, trading below $90 a barrel.
Gareth argued that strategic reserve releases and supply management efforts have helped mute what might otherwise have been a much stronger oil price response. The current calm in energy prices, however, is not without limits—inventory levels in some countries are becoming stressed, and any diplomatic failure combined with reserve exhaustion could trigger a violent spike. For now, any upward movement in oil will face its first major technical resistance at the $100 level.
Bitcoin's Bearish Divergence
One of the most concerning technical developments in the current market is the divergence forming in Bitcoin. Historically, Bitcoin has acted as a high-beta risk asset, tracking the NASDAQ and software stocks with amplified moves in both directions. That correlation has now broken down.
While the NASDAQ sits at all-time highs, Bitcoin is breaking major technical support. After precisely tagging the top target zone of $80,000 to $85,000 that Gareth had previously identified, the cryptocurrency has formed a massive bear flag pattern—and the breakdown is now confirming.
Bitcoin now has downside targets near $65,000, with $60,000 possible if the bear flag fully resolves. When the most speculative assets begin to roll over while the broader market makes new highs, it often signals that the foundation of the rally is starting to crack.
Precious Metals: The Coiled Spring
While Bitcoin breaks down, the precious metals market is setting up for a major directional move. Gold is currently exhibiting textbook moving average compression.
With the 50-period moving average acting as resistance from above and the 200-period moving average providing support from below, price is being squeezed into an increasingly tight wedge.
"This is essentially forming a wedge pattern of moving averages. This is going to compress price. And at some point, one side is going to break," Gareth explained.
When price is compressed this tightly between major moving averages, the eventual breakout is usually explosive. A break to the upside could rapidly test new all-time highs. A confirmed break below the 200MA would bring the $3,500 to $3,600 range into focus.
Silver is already showing its hand. The metal is forming a bear flag below its trendline, suggesting a defined technical setup for a move down to test its own 200-period moving average.
Finding the Lower-Hanging Fruit
The overarching theme of today's analysis is discipline and risk management in a market of extremes. When stocks like ARM are up triple digits in weeks and sporting monthly RSIs in the high 90s, the temptation for retail traders to chase momentum is intense. Professional traders take the opposite approach—they look for beaten-down names with favorable risk-to-reward ratios.
Gareth pointed to software names like Atlassian and Asana as examples. Asana has been heavily sold off and offers a technical setup that could see it return to the $11 to $12 level if sector rotation continues to take hold.
In the commodities space, natural gas recently tagged its 200-period moving average and rejected it. Rather than forcing a trade, the disciplined approach is to wait and watch the critical $3.42 level. If natural gas can break out above that zone, it triggers a cleaner long setup with a favorable risk-reward ratio. If it fails, capital is protected.
The Game Plan Moving Forward
This is a market of extremes. From $400 billion semiconductor valuations and 99-level monthly RSIs, to unusual pre-news price action and supply-management efforts muting oil's reaction to geopolitical conflict—the crosscurrents are real.
The framework is clear: watch 7560 on the S&P 500, monitor the 4.50% line in the bond market, and track the resolution of gold's moving average compression. The sector rotation from semiconductors into software is already underway. Bitcoin's breakdown relative to equities deserves serious attention.
In a market this stretched, the edge is not prediction. It is discipline: know the level, wait for confirmation, and let price decide whether the setup is real.
Trading involves substantial risk. All content is for educational purposes only and should not be considered financial advice or recommendations to buy or sell any asset. Read full terms of service.