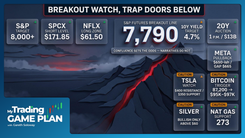
My Trading Game Plan Revealed - 09/18/2026: BOJ Pivot Sparks 10-Year Yield Surge and Historic $7.7T Triple Witching

The Bank of Japan raised interest rates Friday morning, but the hike itself was not what moved markets. The bigger signal came from what the BOJ did not say.
The central bank raised its policy rate 25 basis points to 1.25%, its highest level in more than three decades, but gave markets little reason to price an aggressive follow-up move. The yen weakened after the decision, while U.S. Treasury yields pushed sharply higher.
For traders, that puts the focus right back where it was before Wednesday's Federal Reserve decision: the U.S. 10-year Treasury yield and the 5% area.
That is the chart carrying the most weight today. Everything else, from S&P 500 futures to gold, oil and individual equity setups, has to be viewed through that lens.
The BOJ Hiked. The Yen Fell Anyway.
A rate hike would normally be expected to support a currency. Friday delivered the opposite reaction.
The BOJ raised rates to 1.25%, but the decision included two dissenting votes and offered little additional guidance pointing toward another near-term increase. Analysts described the announcement as underwhelming relative to what the market had hoped to hear about the path ahead.
That helps explain why USD/JPY pushed higher instead of lower.
Gareth focused on that change in tone during Friday's My Trading Game Plan Revealed:
“Japan, basically the bank, didn't guide towards raising again significantly. And this is a big change in character.”
The more important reaction for U.S. traders came in Treasuries. The 10-year yield pushed back toward 5%, trading near 4.98% Friday morning after giving back most of its post-Fed decline. WTI crude was also back above $102, keeping another source of inflation pressure firmly in the picture.
That combination matters because higher long-term yields raise the discount rate applied to future earnings. Growth stocks and other long-duration assets tend to feel that pressure most acutely.
It does not mean stocks automatically fall whenever yields rise. It does mean the 10-year remains one of the cleanest macro filters for whether the current equity rally can continue without interruption.
Why 5.02% Is the Decision Point
Technically, Gareth is watching approximately 5.02% on the 10-year yield.
A break through that area would clear the nearby resistance he sees on the daily chart and force traders to look toward the weekly timeframe for the next major technical zone. His larger projection sits around 5.3% to 5.5% if the breakout confirms.
That would materially change the environment for risk assets.
For now, however, the S&P 500 has not broken its own bullish structure. Price remains above the primary rising trend line Gareth has been tracking.
That creates an important separation between the macro concern and the actual trade signal.
Yields near 5% are a warning. They are not, by themselves, confirmation that the equity trend has broken.
A loss of the first S&P trend line would move Gareth's read toward neutral. A break of the secondary trend line would be the more consequential deterioration in structure.
That level-to-level framework matters because it keeps traders from front-running a bearish outcome simply because the macro backdrop looks uncomfortable.
Expiration Could Distort Friday's Tape
Friday also brings quarterly options expiration, adding another layer of market structure to an already active session.
Citadel Securities estimated in late August that roughly $6.2 trillion of U.S. options exposure was then scheduled to expire on September 18, with the figure expected to rise as shorter-dated positions rolled forward. At the time, Citadel said September was tracking toward June's record $7.7 trillion expiration.
The important point for traders is not that institutions can force the market to a predetermined price. It is that dealer hedging, position rolls and the expiration of large options exposures can create mechanical buying and selling that temporarily overwhelms normal chart behavior.
That can make intraday support and resistance less reliable than usual.
For Gareth, the practical takeaway is straightforward: respect the larger technical levels, but recognize that Friday afternoon could produce price action driven more by positioning than by a new fundamental signal.
Oil Keeps the Inflation Problem Alive
The other chart feeding directly into the rates story is crude oil.
WTI recovered from an early drop Friday and moved back above $102 per barrel. Gareth sees resistance approaching $106, but even without another breakout, triple-digit crude keeps pressure on transportation, production and consumer costs.
Diesel makes the transmission mechanism even clearer. U.S. diesel prices have risen to record levels above $6 per gallon, squeezing transportation and agricultural operators and raising concern about higher costs being passed through the supply chain. Reuters reported a national average around $6.29 on Friday.
That is why energy matters to the Treasury chart.
The longer fuel costs remain elevated, the harder it becomes for markets to assume inflation will cool cleanly enough to relieve pressure on rates.
Refiners have benefited enormously from the resulting economics. Valero (VLO), one of Gareth's recurring charts, remains highly extended after its recent run.
There is now a political wrinkle as well. European finance ministers are discussing whether unusually large energy-sector profits should face windfall taxation, although the European Commission said Friday that it is not currently proposing an EU-wide tax and that individual countries remain responsible for their own tax policy.
For Valero, Gareth's short thesis is primarily technical. The policy discussion is an additional risk factor, not the trade itself.
Apple, Netflix and CrowdStrike: Three Different Kinds of Resistance
The individual equity charts reinforce another theme from today's show: an uncomfortable macro backdrop does not eliminate stock-specific setups.
Apple
Apple has returned to an open gap Gareth has been tracking.
That matters because a gap fill can become a decision point once price reaches the other side of the void. In Gareth's framework, the completed fill gives him a defined area to watch for a possible rejection rather than a reason to chase the recent move.
Reports on iPhone 18 preorder demand have been mixed. Some analysts have pointed to strong lead times, while others have characterized demand as softer than expected. That makes the chart more useful than trying to force a clean fundamental conclusion from the early data.
A rejection from the gap would strengthen Gareth's short thesis. A sustained move through it would weaken that read.
Netflix
Netflix is a different setup.
Wells Fargo downgraded the stock to Underweight Friday and cut its price target from $80 to $57, citing concerns about engagement and the strength of Netflix's upcoming content slate.
The stock is moving toward Gareth's first major support area near $71.50.
He does not view that as an attractive swing-long setup given the broader weakness. Instead, he is distinguishing between timeframe and thesis: a damaged chart can still produce an intraday reaction from major support.
That is a better way to frame the level than assuming support automatically means the larger decline is finished.
CrowdStrike
CrowdStrike is the more extended chart of the three.
Gareth is watching overhead trend-line resistance for a potential swing-short setup, with a downside technical zone around $192 to $188 if the reversal develops.
That area combines an open gap with a rising trend line, giving the projection more technical weight than either reference would have on its own.
The setup still needs the rejection first. Reaching resistance is not the same thing as confirming the short thesis.
Gold Is Refusing to Follow the Usual Script
The cross-asset divergence may be most interesting in gold.
The dollar is pushing into resistance while Treasury yields remain elevated, normally a difficult combination for precious metals. Yet gold has remained relatively firm.
That does not confirm another leg higher by itself, but it is a constructive relative-strength signal.
Silver is also pressing toward a descending trend line connecting several major pivots. A confirmed breakout there would improve the bullish case, while continued rejection would leave the existing structure intact.
Copper is showing the opposite setup.
After breaking below a bearish wedge, copper has rallied back toward the underside of the broken trend line. Gareth describes this as a “retrace to the scene of the crime,” and he is watching CPER for evidence that former support is turning into resistance.
That rejection, rather than the mere existence of the trend line, would be the trigger that strengthens the bearish read.
Bitcoin Held the Level That Mattered
Bitcoin is also refusing to break despite a difficult week.
The CLARITY Act failed to advance in the Senate on Tuesday, losing a procedural vote 49-50 and falling short of the 60 votes required. The defeat is a significant setback for the legislation, although its eventual fate remains uncertain.
Bitcoin nevertheless held the support area Gareth has been watching around $76,000.
That response is what matters technically.
“The tell was that it held this level. This is still a bull flag on Bitcoin. I still remain bullish.”
Holding support keeps the bull-flag interpretation alive and gives the chart a relatively close level against which that thesis can be judged. A breakdown would materially weaken the setup. Continued acceptance above support keeps the upside scenario in play.
That resilience has also appeared in parts of the altcoin market, including Zcash and Hyperliquid, although Gareth sees shorter-term resistance developing in Hyperliquid's parallel channel.
Bottom Line
The most important chart today is not Apple, Bitcoin or oil. It is the 10-year Treasury yield.
The BOJ raised rates, but the yen weakened and U.S. yields moved back toward 5%. Oil above $100 adds another source of inflation pressure, while quarterly options expiration creates the potential for unusually noisy intraday price action.
Yet the equity charts have not confirmed a broader breakdown.
That is the tension heading into next week.
A sustained move through roughly 5.02% on the 10-year yield would increase the pressure on risk assets and put Gareth's higher yield projections back in focus. Until the S&P 500 loses its own technical structure, however, the macro warning and the price signal remain two different things.
The job is not to predict which one wins. It is to know exactly which levels tell you when the balance has changed.
Trading involves substantial risk. All content is for educational purposes only and should not be considered financial advice or recommendations to buy or sell any asset. Read full terms of service.