My Trading Game Plan Revealed - 09/22/2026: S&P 500 Breakout Toward 8,000 Bitcoin Trend Reversal Oil Slide Tech Shorts and Value Rotation

The most important chart in this market is not crude oil, the 10-year Treasury yield, AMD, or even Bitcoin.
It is the S&P 500.
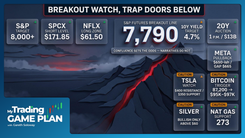
After spending the past several sessions absorbing 5% Treasury yields, elevated crude prices, and another round of Federal Reserve tightening, the index finally pushed through the technical level Gareth Soloway had been watching near 7,700. Monday’s 114-point advance took the S&P 500 to 7,764.70 and turned what had been a developing bull flag into a confirmed breakout on Gareth’s chart.
That matters because several other markets are now moving in ways that support the same risk-on setup. Treasury yields have backed away from 5%. Crude oil has fallen sharply. Technology stocks are breaking higher. Bitcoin has pushed through an important prior high.
The question now is not whether Monday was bullish. It clearly was.
The more useful question is what would keep that breakout intact.
7,700 Becomes the S&P 500 Line to Defend
The S&P 500 spent last week consolidating beneath a descending trendline drawn from the August 28 high through the September 3 high. Gareth viewed that consolidation as a bull flag developing after the prior advance.
Monday changed the structure.
The index closed at 7,764.70, clearing the 7,700 area Gareth had identified as the important breakout level. As long as price remains above that zone, his near-term read stays bullish.
That creates a simple hierarchy.
The first level is 7,700. Holding above it keeps the breakout intact.
Above that, Gareth is watching a larger macro trendline around 7,900. Beyond it sits the psychological 8,000 level.
Those are objectives, not promises. The more important information is what happens if the market fails to hold the breakout. A move back below 7,700 would force traders to reassess whether Monday produced a durable breakout or another failed push through resistance.
That is especially important after the market's reaction to last week's Federal Reserve decision. Stocks initially sold off before recovering, suggesting that the market was able to absorb tighter monetary policy without breaking the broader technical structure.
Price ultimately mattered more than the initial headline reaction.
Falling Yields Are Giving Stocks Room
The bond market is helping.
The 10-year Treasury yield recently tested the 5% area but moved back below that threshold Monday and continued easing Tuesday morning.
For equities, that removes some immediate pressure from the discount-rate side of the equation. It does not mean the bond problem has disappeared.
Gareth is watching a developing consolidation in the 10-year yield that could eventually become a bull flag of its own. Right now, however, he considers that pattern immature.
That distinction matters.
A few sideways sessions do not automatically create a high-conviction continuation setup. The longer a structure develops and the more clearly its boundaries form, the more useful it becomes as a technical signal.
For now, falling yields support the equity breakout. If yields stabilize and begin pushing through 5% again, that relationship could change quickly.
The chart does not require traders to predict which outcome is coming. It gives them the level that tells them when the evidence has changed.
Oil Is Reinforcing the Same Risk-On Signal
Crude oil is moving in the same direction.
After surging above $100 per barrel, WTI has fallen sharply as markets react to improving regional oil flows and the possibility of renewed U.S.-Iran diplomacy. Saudi exports through the Strait of Hormuz have increased materially, helping ease some of the supply concerns that drove the earlier spike.
For Gareth, however, the chart came first.
Oil had already reached an important technical resistance area before the recent decline. The change in the fundamental backdrop then helped reinforce that resistance rather than creating the setup by itself.
That is a useful distinction for traders.
A headline can explain why a move accelerates. It does not necessarily identify where the move becomes vulnerable.
Gareth is now watching the low-$90s as the next near-term area of interest, with approximately $87 becoming more important if crude continues breaking lower.
For equities, continued weakness in oil would remove another source of inflation pressure. A renewed crude spike would complicate the S&P breakout, particularly if it pulled Treasury yields higher with it.
AMD Shows Why Entry Strategy Matters at Resistance
Monday's technology rally produced one of the clearest examples of momentum running directly into technical resistance.
AMD surged nearly 10% and reached a $1 trillion market capitalization for the first time as enthusiasm around AI infrastructure returned to semiconductor stocks.
The stock's strength does not automatically make it attractive at any price.
Gareth is watching a major descending trendline extending from the 2024 high. His resistance zone becomes more important as AMD moves above roughly $620.
That creates the type of setup where position management matters as much as identifying the level.
When a stock is accelerating into resistance, immediately taking a full countertrend position means trying to call the exact point where momentum stops. Gareth instead favors scaling into setups like this gradually.
The logic is straightforward. A powerful trend can overshoot resistance before reversing. Beginning smaller gives the chart room to develop while preserving flexibility if price stretches beyond the initial level.
The trade thesis is not simply “AMD is too high.”
It is that AMD is approaching a technically important area after an unusually strong run, and the reaction there should reveal whether buyers still have enough momentum to push through it.
Meta Shows the Other Side of the AI Trade
Meta provides a similar lesson from a different part of the technology complex.
Shares jumped roughly 11% Monday as investors responded to the early traction of Meta's Muse AI assistant, which launched September 8 and climbed to the top of Apple's U.S. App Store.
The move pushed Meta's market capitalization to roughly $1.9 trillion.
The short-term signal is straightforward: markets remain willing to aggressively reward companies that can show credible AI adoption or monetization potential.
The longer-term question is harder.
As more companies develop competing AI products, the economics of those products will matter increasingly alongside the technology itself. Competition could pressure pricing and margins even if aggregate AI demand continues growing.
That is not a reason to fade the current momentum by itself. It is a reason to separate the short-term chart from the longer-term valuation narrative.
Falling Oil Could Help the Beaten-Down Consumer Names
Away from technology, Gareth is also watching another part of the market for a different reason.
Stocks including Nike, Clorox, and McDonald's have spent extended periods under pressure, leaving several of them technically oversold.
Now crude is falling.
Lower energy costs can eventually relieve some pressure on consumers and businesses, but that transmission is neither immediate nor guaranteed. The chart still has to confirm that buyers are returning.
McDonald's is one of the names Gareth is watching most closely.
The stock is moving toward the lower boundary of a large parallel channel. If price reaches that support and begins responding to it, Gareth sees the area as technically interesting.
That is a much cleaner framework than simply buying something because it looks cheap.
Oversold can become more oversold. Support matters when price actually begins respecting it.
Gold and Silver Still Require Patience
Not every market is breaking out.
Gold and silver remain trapped inside their respective parallel channels, producing the kind of back-and-forth price action that can punish traders who chase every daily move.
Until either metal clears its channel, there is little reason to manufacture a directional signal that the chart has not provided.
The same principle applies to natural gas.
Gareth is watching approximately $3.00 on the upside and $2.70 on the downside. A confirmed break above $3.00 would put roughly $3.30 back in focus, while a loss of $2.70 would shift attention toward $2.50.
Until one of those boundaries gives way, the range itself is the story.
Bitcoin's Higher High Changes the Crypto Conversation
Bitcoin may have produced the second-most important chart development behind the S&P 500.
After months of lower highs, Bitcoin pushed above $86,000 Monday and reached its highest level since January.
On Gareth's chart, that move created the first meaningful higher high of the current recovery.
That does not guarantee the broader decline is over, but it changes the structure.
A downtrend is defined by lower highs and lower lows. Once price begins breaking that sequence, traders have to account for the possibility that the trend itself is changing.
The practical implication is that future Bitcoin pullbacks now deserve to be evaluated differently. Instead of automatically treating every rally as another opportunity for sellers to regain control, Gareth is watching whether buyers begin defending higher support levels.
That is the next test.
A higher high becomes much more meaningful if it is eventually followed by a higher low.
The Bottom Line
Monday's rally was bigger than a one-day move in the S&P 500.
Several markets that had been pressuring equities began moving in the opposite direction at the same time. Treasury yields slipped back below 5%. Crude oil continued falling. Technology leadership strengthened. Bitcoin broke through an important prior high.
The S&P 500 remains the anchor.
Above roughly 7,700, Gareth's breakout thesis stays intact, with the larger trendline near 7,900 and eventually 8,000 coming into view. A move back below the breakout zone would weaken that read and force a reassessment.
That is the advantage of working from levels rather than narratives.
You do not need to know in advance whether oil keeps falling, yields resume climbing, or Bitcoin's breakout develops into a larger trend change.
You need to know which levels tell you when the evidence has changed.
Trading involves substantial risk. All content is for educational purposes only and should not be considered financial advice or recommendations to buy or sell any asset. Read full terms of service.