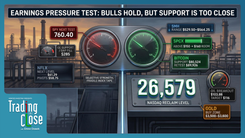
My Trading Game Plan Revealed - 09/24/2026: 10-Year Yields Hit 5.1% Stocks Hold Oil Gold Bitcoin Trade Setups

The 10-Year Yield Is Breaking Out. The Stock Market Still Isn't Breaking Down
By Gareth Soloway, Verified Investing, September 24, 2026
The 10-year Treasury yield pushed through 5.02% and reached 5.1% overnight, extending a move that has become the most important macro pressure point for equities. But the bigger signal from this morning's market is not simply that yields are surging. It is that stocks are still refusing to break down with them. Despite borrowing costs reaching levels not seen since 2007, the S&P 500 remains roughly 2% below its all-time highs. That resilience keeps Gareth Soloway's near-term technical read on equities bullish as long as the index holds its key support structure.
Gareth notices a disconnect. On August 13, the 10-year yield was around 4.67%. It is now near 5.1%, yet the S&P 500 is down only about 1.5% from where it traded that day. Higher yields are a legitimate headwind because they raise the cost of capital and put pressure on valuations, but price is showing that equities have absorbed that pressure remarkably well so far. Gareth's framework is straightforward: respect the risk coming from rates, but do not turn bearish on stocks simply because the macro backdrop says they should be falling.
The 10-Year Is Driving the Tape
The intraday action reinforced just how tightly stocks are trading against yields. Around 5:40 a.m. ET, the 10-year yield formed a bottoming tail and began pulling back. S&P futures started recovering from their lows at essentially the same time. That inverse relationship is the market's immediate tell.
The push to roughly 5.1% on the 10-year confirms that the bond market is still applying pressure. Overnight, yields jumped roughly 16 basis points. For perspective, the Federal Reserve's latest rate increase was 25 basis points, so the speed of the move is noteworthy.
For equities, however, confirmation still has to come from price. As long as the S&P remains above Gareth's technical neutral line, the chart continues to argue for a bullish bias. If stocks eventually lose that structure while yields remain elevated, the read changes. Until then, the divergence itself is information: rates are delivering a substantial headwind, and equities have not yet buckled under it.
Oil Feeds Back Into Rates
The geopolitical headlines surrounding the Middle East matter to markets primarily through one transmission mechanism: energy. Higher oil prices can keep inflation pressure elevated, which makes it harder for interest rates to come down. That ultimately feeds back into the 10-year yield that is already pressuring equities.
Oil is now sitting near an important rising support line on Gareth's chart. A confirmed break would open the door to roughly \$87 per barrel, followed by a potential move toward \$80. That would be meaningful relief from current levels, although oil would still be well above the prices seen earlier this year.
Diesel adds another layer. Higher diesel costs work through transportation and distribution expenses, giving businesses another cost that can eventually reach consumers. That is why the oil chart cannot be separated from the rates discussion. Falling energy prices would remove some inflation pressure. A renewed oil surge would make the 10-year's breakout more difficult for equities to absorb.
The Dollar Is Testing Gold and Silver
The U.S. Dollar Index is adding another source of pressure, with DXY approaching Gareth's major resistance trend line near 101.63. A rapidly strengthening dollar generally creates a tougher backdrop for dollar-denominated commodities, which makes the current positioning in gold and silver particularly important.
Gold is still holding a rising support line formed by connecting its recent pivot lows. That keeps Gareth's near-term read neutral to bullish despite the dollar's strength. The risk is the failure of that support. If the trend line gives way, the chart opens the possibility of a larger retracement toward \$4,000 or potentially lower.
Silver is showing somewhat weaker price action but remains near its own parallel support line. A breakdown there puts roughly \$59 to \$60 into focus, followed by another support area near \$55. For both metals, the setup is less about predicting what the dollar does next and more about watching whether support survives the pressure already being applied.
Bitcoin's Structure Has Changed
Bitcoin is giving a different signal. The pullback alongside gold and silver does not erase the structural change Gareth sees on the larger chart.
A downtrend requires lower highs and lower lows. Bitcoin has broken that sequence and is now producing higher highs and higher lows, while areas that previously acted as resistance are beginning to function as support. That changes the technical read.
It does not mean Bitcoin cannot experience another sharp pullback. It means the burden of proof has shifted. The recent advance increasingly looks like a change in trend rather than simply another bounce within the prior bearish structure. As long as Bitcoin continues defending those higher lows and former resistance holds as support, the bullish structure remains intact.
McDonald's Shows Why Price Can Matter More Than Sentiment
Gareth's McDonald's trade offered the clearest example of how this framework translates from macro analysis into an individual setup.
McDonald's recently dropped roughly 5% in a single session following negative headlines surrounding market share and restructuring costs. The easy response is to look at the news, see the selling and stay away. Gareth looked at where the selling took the stock instead.
MCD fell directly into a major long-term channel on the weekly chart, a structure connecting important pivots going back more than a decade. That creates the type of reversion setup Gareth looks for: a heavily beaten-down stock reaching a historically significant technical level while sentiment is overwhelmingly negative.
That does not make support automatic. It creates a defined trade location. The attraction is the asymmetry between buying after a large decline at established support and chasing price after the crowd has already moved in the opposite direction. If the long-term channel holds, the reversion thesis remains intact. If it fails, the chart has provided the trader with a clear signal that the setup has changed.
AI Volatility Is Creating More of These Setups
The same principle is beginning to appear elsewhere as AI developments create sharp moves across individual stocks.
Meta showed the other side of the setup. Expectations had built ahead of its AI event, but once the news arrived, the stock printed topping tails and began retracing. That is classic sell-the-news behavior: the event itself can be positive while the stock falls because price had already discounted much of the optimism beforehand. If the pullback continues, Gareth is watching a former breakout area below as the next meaningful support.
Booking Holdings and Bank of America are approaching levels that could create similar risk-defined opportunities. BKNG is selling off toward major double-bottom support near \$150, while BAC is approaching an ascending trend line just below \$55. The important part is not simply that these stocks are falling. It is where the decline takes them.
Bottom Line
The 10-year yield is sending a warning, but the S&P 500 has not confirmed it.
That is the tension defining Gareth's market framework right now. Yields have broken above 5.02% and reached roughly 5.1%, yet equities remain close to their highs and above the technical structure that keeps the near-term bias bullish. The macro pressure is real, but price still gets the final vote.
That same discipline applies across the rest of the market. Gold and silver have support levels that define whether their structures survive a stronger dollar. Bitcoin's move into higher highs and higher lows has changed its technical character. McDonald's, Booking Holdings and Bank of America show how aggressive selling can create opportunity when it reaches established support rather than simply producing more downside.
Watch the levels that force the market to prove its case. If equities hold their structure despite 5% yields, that resilience matters. If support begins breaking while yields remain elevated, the market will be telling traders something different. Until price gives that confirmation, the chart matters more than the fear surrounding it.
Trading involves substantial risk. All content is for educational purposes only and should not be considered financial advice or recommendations to buy or sell any asset. Read full terms of service.