Trading The Close Market Recap - 09/23/2026: Yields Surge Sends Stocks Lower — NASDAQ & Semis Show Resilience

The most important signal into today's close was not simply that stocks sold off. It was that two major indexes treated nearly identical breakout setups very differently.
Earlier this week, both the S&P 500 and Nasdaq Composite pushed through declining trend lines. The Nasdaq followed its breakout with another move higher. The S&P did not. That difference is now showing up clearly in the charts.
It is a useful reminder of why the first move through resistance is rarely enough. A breakout tells you price crossed a level. Extension tells you buyers were willing to keep paying higher prices after the level was cleared. Without that second step, traders remain vulnerable to exactly what happened in the S&P today: price rolled over, lost the breakout line and turned what looked bullish earlier in the week back into a questionable setup.
With Treasury yields pressing higher at the same time, confirmation matters even more. The market is not trading in an environment where every breakout deserves the benefit of the doubt.
The S&P Failed the Test. Nasdaq Hasn't Yet.
The S&P's breakout looked constructive when price initially pushed above its declining trend line. What it never produced was meaningful extension above Monday's high.
That became the warning.
On the 10-minute chart, price eventually slipped back through the trend line, attempted a weak reclaim and then continued lower. Rather than expanding away from resistance after the breakout, the S&P effectively fell back into the prior structure.
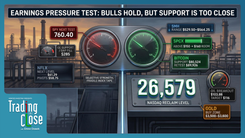
That puts attention back on support. SPY has an important area around $760.40, a level price has already interacted with several times. Another test becomes increasingly important because repeated interaction with support can reduce the amount of buying interest waiting there.
The Nasdaq is giving traders a different read.
After clearing its own declining trend line, the Nasdaq extended higher on Tuesday. That extra push created separation between price and the breakout level before today's weakness arrived. As a result, the index is still holding above its declining trend line, with near-term support around 26,692.
That does not guarantee the Nasdaq holds. It does show why extension matters.
Two charts can technically "break out," but they are not necessarily telling traders the same thing. The S&P crossed resistance and stalled. The Nasdaq crossed resistance and proved there were buyers above it. Today's pullback exposed that difference.
The 10-Year Yield Raises the Bar for Equity Breakouts
The bond market is making that distinction more important.
The Federal Reserve raised its target range by 25 basis points last week to 3.75%-4.00%, and longer-term yields remain elevated. The Federal Reserve's latest published H.15 data showed the 10-year Treasury yield at 4.96% on September 21 after trading at 5.01% on September 18.
On Drew's chart, the broader technical structure remains the bigger issue. The 10-year has been climbing through a long-term channel that stretches back decades, while momentum has pushed into overbought territory.
The next levels on that structure sit around 5.76%, followed by 6.249%.
Those are not predictions that yields must travel there. They are the next technical areas that become relevant if the current move continues.
For equities, the transmission mechanism is straightforward. Higher long-term yields raise the hurdle for valuations, particularly in areas where investors are paying heavily for future growth or comparing equity income against increasingly competitive fixed-income returns.
That is why today's failed S&P breakout deserves more attention than it would in isolation. The index lost momentum while one of the market's larger macro pressures is still moving in the wrong direction for equity multiples.
Semiconductors Show Where Strength Still Exists
SMH remains one of the more useful counterpoints to the broader weakness.
The semiconductor ETF pulled back roughly 1% today, but its larger structure remains much stronger than the S&P's. Since the April 2025 low, semiconductors have produced an unusually large advance within a broad parallel channel.
The short-term chart, however, shows why traders still need to respect resistance even inside a strong trend.
After breaking a declining trend line, SMH moved rapidly higher over seven sessions. The 61.8% Fibonacci retracement of the most recent downswing came in at approximately $607.58, and that is where price ran into resistance today.
That gives traders a clean framework.
If SMH stabilizes and eventually clears $607.58, the strength of the larger semiconductor trend remains difficult to ignore. If selling continues, the top of the prior parallel channel around $585.15 becomes the more important support test.
The lesson is not that semiconductors are immune to today's pressure. It is that the sector has more technical cushion than the S&P currently does.
That internal divergence is worth watching. If SMH continues holding structure while the major indexes weaken, leadership has not fully broken. If semiconductor support begins failing as well, the weakness becomes broader.
Gold Breaks Structure While Silver Holds Its Line
Precious metals are also separating technically.
Gold closed beneath the rising parallel channel that had supported price since April 2025. That changes the near-term chart. As long as price remains below that channel, the next important support area comes in near $4,219.
Silver took the larger percentage decline today, but its technical structure is arguably cleaner.
Price is sitting near an important trend line around $64.53. That level also corresponds with the neckline area from the prior head-and-shoulders setup that failed to confirm.
As long as silver continues producing daily closes above that level, the bullish structure has not been invalidated. A confirmed close beneath it would change the setup.
This is another example of why the size of the daily move can be misleading. Silver fell harder today, but gold is the asset that actually broke an important piece of chart structure.
Bitcoin Returns to the Other Side of Its Old Breakdown
Bitcoin is dealing with a similar support-versus-resistance problem.
The bottom of its parallel channel recently held and prevented further downside following the prior head-and-shoulders breakdown. That defense helped Bitcoin rebound, but the bounce now creates a different test.
The old neckline near $88,858 becomes resistance on the way back up.
That is a common piece of market structure. Support that breaks can become resistance when approached from underneath. Traders who bought around the old level and sat through the breakdown may use a return to that price as an opportunity to exit, creating supply where buyers previously expected support.
Ethereum has its own version of that problem. Its parallel channel held, but price faces a rising resistance trend line dating back to 2022, with another resistance area around $3,041.
The broader lesson applies beyond crypto: watch how price behaves when it returns to a level shortly after testing it.
A strong rejection from support followed by sustained extension is constructive. A small bounce followed by an immediate return to the same level deserves more caution. Each test can consume some of the orders that created the initial reaction.
Individual Stocks: Let Price Come to the Setup
Today's weakness also produced several individual charts worth monitoring, but the same rule applies to all of them: the level comes before the trade.
McDonald's is a good example. The stock broke beneath a rising parallel channel that had contained price since 2022. Rather than trying to catch the first drop, Drew's chart points farther down to a larger confluence area near $232.79, where the 50% Fibonacci retracement from the COVID-era low aligns with prior consolidation.
The daily RSI is also deeply oversold, but that alone is not the setup. The attraction is the combination of price support, Fibonacci structure and stretched momentum. If $232.79 is tested and holds, a rebound toward the broken channel near $273.55 comes into view.
Google is much closer to its level. Shares sold off into the $332.60-$333 area, where a gap fill intersects with a rising support trend line.
What matters next is the reaction.
A decisive bounce would confirm that buyers are still defending the trend. If price only drifts away from support and quickly returns, that defense becomes less convincing. The first nearby upside area sits around $340.64.
Fastly offers the opposite type of setup because traders are waiting for confirmation rather than support. FSLY is forming a multi-month inverse head-and-shoulders pattern, but the pattern has not triggered. A daily close above the neckline near $29.83 would provide that confirmation.
Until then, it remains a setup, not a breakout.
If confirmed, $34.82 becomes the first meaningful resistance area before the larger measured move comes into play.
The Bottom Line
Today's close offered a useful reminder that crossing resistance and confirming a breakout are not the same thing.
The S&P moved through its declining trend line but never generated the extension needed to strengthen the breakout. The Nasdaq did, and that extra confirmation is why its structure remains intact despite today's weakness.
At the same time, elevated Treasury yields are raising the standard for bullish equity setups. Semiconductors still have technical strength, but even SMH is encountering defined Fibonacci resistance. Gold has already broken an important channel, while silver remains above its key line. Bitcoin and Ethereum are running into former support and longer-term resistance.
The common thread is confirmation.
Do not treat the first touch, first break or first bounce as the entire setup. Watch what price does afterward. A real move should create separation from the level. When it cannot, the chart is telling you something.
That is the framework to carry into the next session: know the level, wait for price to prove itself, and let extension separate the breakout from the fakeout.
Trading involves substantial risk. All content is for educational purposes only and should not be considered financial advice or recommendations to buy or sell any asset. Read full terms of service.