My Trading Game Plan Revealed - 09/28/2026: Yields Oil and AI Earnings Drive Markets as Gold Crashes and Bitcoin Holds

Yields And Oil Are Pressuring Stocks, But The Bullish S&P Setup Has Not Broken
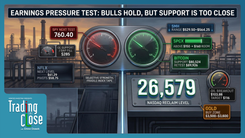
The pressure on stocks this morning is coming from a familiar combination: oil is back near $100, the 10-year Treasury yield is pushing above 5.2%, and the S&P 500 is pulling back. But the important part of today's setup is how closely they are moving together, and what has not happened yet. Despite another push higher in yields and renewed strength in oil, the S&P 500 is still holding its recent bull-flag breakout and remains above the level that would change Gareth Soloway's near-term read.
That makes this a market where the headline and the chart are giving traders slightly different messages. Rising yields and oil are obvious headwinds for equities. Technically, however, the S&P has not confirmed the bearish case. Until it does, Gareth's framework remains straightforward: watch oil, watch the 10-year, but let the S&P's own price structure determine when the bullish setup has actually failed.
The Three Charts Driving The Market
The 10-year Treasury yield, crude oil, and the S&P 500 are effectively trading as one interconnected macro setup right now. The relationship was visible intraday. As crude pushed toward $100, the 10-year yield moved toward its highs and the S&P sold off. When oil backed away from $100, yields eased and stocks began to recover.
The 10-year is now around 5.215%, putting it within striking distance of the 5.25% to 5.27% area Gareth has been watching. On the long-term chart, yields are pressing into major pivots stretching back to 2006 and 2007. A rejection there would relieve some of the pressure currently hitting equities. A clean breakout would change the equation, with the chart potentially opening a path toward 5.5%.
There is also a macro difference between today's 5% yield environment and the one traders saw nearly two decades ago. The federal debt load is substantially larger, which means the economic cost of sustaining these rates is also larger. That does not tell us exactly when yields will turn, but it raises the stakes around this long-term resistance test.
Oil is adding another layer to the same trade. WTI briefly pushed toward $100 before pulling back into the upper $97 area. Higher crude feeds inflation concerns, which can keep upward pressure on yields and make the Federal Reserve's job more difficult. That is why the market's reaction to oil is showing up almost immediately in bonds and equities.
The S&P Is Bent, Not Broken
Against that backdrop, the S&P 500 is showing more resilience than the macro headlines would suggest. The index recently broke out of a bull flag, and despite this morning's weakness, price remains above Gareth's neutral line around 7,575.
That level keeps the hierarchy clear. Oil near $100 matters. A 10-year yield above 5.2% matters. But neither automatically invalidates the bullish S&P structure. Price has to do that.
As long as the S&P holds above the neutral line and preserves the bull-flag breakout, Gareth continues to give the near-term bullish structure the benefit of the doubt. A failure back below that area would be more important than another scary move in yields because it would finally show that the macro pressure is translating into technical damage in equities.
That is also why Wednesday's PCE inflation report and Friday's nonfarm payrolls report carry more weight than usual. The market does not simply need strong economic data. It needs data that is strong enough to avoid recession fears without being so strong that the Federal Reserve has to become more aggressive.
The Goldilocks analogy fits. Too weak and the market begins worrying about growth and earnings. Too strong and traders have to price a more hawkish Fed. The market wants something in the middle.
Gold And Silver Just Changed Their Technical Read
While the S&P is absorbing the pressure, gold and silver are not.
Gold has broken below the ascending parallel channel that had contained its advance, falling more than 3% and producing one of its largest down candles of the past month. The first areas Gareth is watching are roughly $4,250 and then the $4,125 to $4,100 zone. If those levels cannot stabilize the chart, the larger technical structure leaves room for a move back toward $3,900.
Silver has now broken its ascending parallel as well. With price near \$61, the breakdown puts approximately $55 into view as a larger support area.
This is where one of Gareth's recurring technical concepts becomes especially useful: the “retrace to the scene of the crime.”
A breakout does not require price to keep moving vertically. Markets frequently return to the area where the original breakout occurred, retest it from the other side, and then make the next decision. That is why the current decline in precious metals needs to be viewed through levels rather than emotion. The question is not whether gold and silver are down sharply today. The question is where buyers reappear and whether former breakout zones hold when tested.
The break of the ascending channels means the charts have changed. It does not mean traders should assume a straight-line collapse from here.
Bitcoin Is Holding Up Better Than The Metals
The contrast with Bitcoin is notable. Bitcoin is pulling back, but its chart has suffered far less technical damage than gold or silver. Relative to the precious metals complex, Bitcoin remains the stronger structure.
The key now is whether Bitcoin can hold the previous major resistance area that it recently broke above. That level had rejected price multiple times before the breakout. A successful retest would be another example of the “scene of the crime” setup and would strengthen the argument that Bitcoin's larger structure has changed.
Natural gas is creating a similar lesson from a different direction. After a sharp run higher, price has pulled back toward an area defined by previous high pivots. Gareth is not interested in chasing the original move. The better setup comes if price returns to a predetermined technical level and then gives confirmation.
That is an important distinction in today's market. A large move can attract attention without offering a good trade. The level after the move is often more useful than the move itself.
AI Stocks Are Still Priced For Perfection
Individual technology names are creating another set of opportunities, but the psychology is different. Nvidia, Micron, and MongoDB show how aggressively the market is still pricing AI-related expectations.
Nvidia moved higher following news of an additional $170 billion in stock buybacks. Technically, Gareth is watching the gap around $236 as the next resistance area. If Nvidia pushes through that level, the larger trend line near $260 becomes the more interesting zone.
Micron reports earnings Wednesday after the close, making preplanned levels more important than predicting the report. On an upside move, Gareth sees a major gap fill lining up with the 78.6% Fibonacci retracement, creating technical confluence. On a downside reaction, the first major support area comes from the combination of a rising trend line and gap support.
The point is not to guess whether Micron beats or misses. It is to know where the chart becomes interesting after the information is public.
MongoDB provided the clearest example of how unforgiving the AI trade has become. The stock fell more than 20% following the CEO transition and the company's decision to reaffirm rather than raise forward guidance. In a part of the market where expectations are elevated, simply maintaining guidance can be treated as disappointment.
But a large decline does not automatically create a trade. Gareth's focus shifts to approximately $294, where multiple previous pivot lows create a much clearer technical support zone. If price reaches that area, the chart offers a defined level to evaluate rather than an emotional attempt to catch a falling stock.
The Market Keeps Dealing New Cards
The common thread across all of these setups is probability.
Gareth compared trading to watching a poker hand. Every time another card is turned over, the odds change. Charts work the same way. A broken trend line, a successful retest, an economic report, or a failure at resistance adds new information and changes the setup.
Gold breaking its ascending channel changes the odds for a deeper retracement. The S&P holding its bull-flag breakout keeps the bullish structure alive despite rising yields. Bitcoin holding former resistance would strengthen its larger technical reversal. None of those outcomes has to be predicted in advance.
That is why missing a move is not the problem traders often think it is. There will always be another setup. Chasing because something already moved usually means accepting worse risk/reward simply because the market created FOMO.
The better approach is to define the important levels first and make the market come to you.
Bottom Line
The biggest signal this morning is the tension between the macro pressure and the equity chart. Oil is elevated, the 10-year yield is testing a major long-term resistance area, and precious metals have already suffered meaningful technical breakdowns. Yet the S&P 500 has not broken the structure that has kept Gareth near-term bullish.
If yields reject the 5.25% to 5.27% area and oil continues backing away from $100, some of the pressure on equities can unwind quickly. If yields break higher and the S&P loses its neutral line around 7,575, the technical picture changes with it.
Until then, the game plan is to know which levels will tell us when the odds have changed.
Trading involves substantial risk. All content is for educational purposes only and should not be considered financial advice or recommendations to buy or sell any asset. Read full terms of service.