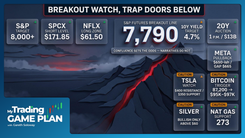
My Trading Game Plan Revealed - 10/01/2026: Yields Drive Markets S&P 500 Equal Weight Diamond Setup and Semiconductor Headwinds

Yields Are Driving the Market, but the S&P 500 Is Hiding the Bigger Setup
In this morning's My Trading Game Plan Revealed, Gareth Soloway started with the bond market: equities are moving almost tick for tick with Treasury yields, while mega-cap technology continues to mask weakness across a much broader group of stocks.
That divergence is creating two very different markets. The cap-weighted S&P 500 remains technically resilient, and only about 2% below its all-time high, but the equal-weight index has already taken a much larger hit. For traders, that is where the more interesting setup is developing. The market may look like it is holding together, but beneath the surface, parts of it are already approaching levels where risk/reward begins to improve.
Treasury Yields Are Setting the Tone for the S&P 500
Gareth pointed out the relationship in real time during the morning broadcast. When yields moved higher, equity futures pulled back. When yields eased, buyers returned. Overnight, the 10-year yield pushed as high as 5.34% while S&P futures sold off. As the yield backed down toward 5.31%, futures recovered.
That is the transmission mechanism traders need to understand. At these levels, small changes in yields can have an outsized impact on equity valuations, particularly when yields are sitting at levels not seen in more than two decades. Add oil above $90 per barrel, and financial conditions remain restrictive even while the headline indices continue to show surprising resilience.
The S&P 500 has now posted losses in six of its last seven sessions, yet it remains only about 2% below its all-time high and above the neutral zone Gareth is tracking on the daily chart. That keeps the broader technical structure intact for now.
S&P 500 Strength Is Hiding Weakness in the Equal-Weight Market
The cap-weighted S&P 500 is increasingly dependent on its largest companies. Gareth used Nvidia to illustrate just how extreme that concentration has become, noting that its roughly $5 trillion market capitalization is comparable to the combined value of more than 200 smaller companies in the index.
That weighting matters. A strong move in a handful of mega-cap stocks can keep the S&P 500 near its highs even while a large portion of the market is moving in the opposite direction.
The Invesco S&P 500 Equal Weight ETF (RSP) gives traders a cleaner view of that weakness. While the S&P 500 is roughly 2% from its highs, RSP is about 7% below its all-time high, with many underlying stocks already below their 50-day moving averages.
That sounds bearish, but it is also where the opportunity begins to develop.
The level Gareth is watching on RSP is $205 to $204.70, where three technical factors converge. Former resistance from an inverse head and shoulders pattern comes back into play as potential support, an unfilled daily gap sits in the same area, and the 50% Fibonacci retracement from the prior major swing aligns with the zone.
That is the setup. The value is in the confluence.
When several independent technical factors point to the same price, Gareth's interest increases because the trade has a clearly defined area where buyers should appear. Instead of chasing an index that remains near record highs, the equal-weight chart is moving toward a level where the risk/reward becomes much easier to define.
Quarter-End Selling Is Creating New Trading Opportunities
The start of a new quarter adds another layer to the setup.
Gareth highlighted what he calls "window undressing," the tendency for institutional managers to unload some of their worst-performing positions near quarter-end before portfolio statements reach clients. Whatever the motivation behind individual trades, the important part for traders is the effect: already weak stocks can face another wave of selling that is tied more to positioning than a sudden change in the underlying company.
When the calendar flips, that pressure can disappear.
FICO offered a clean example. After a steep decline into parallel trend line support, the stock closed around $592 before jumping toward $640 in premarket trading as the new quarter began. The chart had already been stretched. Once the additional quarter-end pressure faded, price snapped back.
Nike is another name Gareth is watching through that lens. The stock has been trading near 52-week lows and is sitting around a major support area heading into earnings. That does not guarantee a reversal. It means the combination of depressed expectations, technical support and the removal of quarter-end pressure creates a setup worth watching for confirmation.
Weakness alone is not the signal. The opportunity develops when forced or temporary selling pushes price into a technical level where the downside can be clearly defined.
Micron Earnings Highlight New Risks for Semiconductor Stocks
The semiconductor trade deserves a different framework.
Micron delivered the type of earnings report that would normally support the stock, including better-than-expected revenue and earnings along with stronger forward guidance. Yet the shares failed to respond meaningfully and traded slightly lower after the report.
That reaction matters more than the headline beat.
When good news fails to push a stock higher, the market may already be looking beyond the current quarter. Gareth's longer-term concern centers on supply. New memory-chip capacity coming online could eventually pressure margins that are currently extremely strong. His view is that the risk becomes more meaningful over the next year to year-and-a-half as additional supply reaches the market.
There is a second issue developing as well: efficiency.
As AI software becomes better at extracting more performance from existing hardware, the assumption that computing demand must continue rising at the same rate becomes less certain. Gareth connected that risk to the market's reaction to DeepSeek in 2025, when evidence that advanced AI could operate with less computing power forced investors to reconsider some of their hardware-demand assumptions.
Strong earnings are no longer enough by themselves. The market is beginning to ask whether today's margins and hardware demand can persist as both supply and software efficiency improve.
For Micron specifically, Gareth identified a deep gap-fill level at $10.15 as the area where the short-term risk/reward would become more interesting. Until price reaches the level he is targeting, patience remains part of the trade.
Gold's Tests $4,100 Support as Precious Metals Pull Back
Precious metals are also approaching decision points.
For gold, Gareth's line in the sand is $4,100. The metal has pulled back from its recent highs and is testing an ascending trend line near that level. As long as support holds, the existing structure remains intact. A confirmed break below it changes the near-term read and opens the door to approximately $3,900, with $3,500 representing Gareth's more aggressive downside scenario.
That near-term risk is separate from his longer-term macro thesis. Verified Investing's proprietary model continues to point toward a much higher long-term gold target, but traders do not need to ignore shorter-term downside simply because they remain bullish over a longer horizon.
Silver is in a similar position. A failure of its current trend line could open a move toward $50 per ounce, particularly if economic weakness begins to weigh on industrial demand.
The lesson is simple: a long-term bullish thesis does not remove the need to respect near-term technical structure.
Bitcoin Dominance Is Warning Altcoin Traders
Bitcoin itself has gone almost nowhere over the past two weeks, leaving the short-term chart open to more than one interpretation. The more useful signal may be coming from Bitcoin dominance.
While Bitcoin has moved sideways, BTC dominance has pushed higher and broken out of its recent consolidation. That tells Gareth that capital is favoring Bitcoin relative to the broader crypto market.
For altcoins, that is a warning.
Highly extended names such as Zcash become more vulnerable when Bitcoin dominance is rising, especially after a move of roughly 250%. A 30% retracement after that type of advance would not be unusual from a technical perspective.
The key signal is where capital is moving while Bitcoin consolidates. Right now, the dominance chart says Bitcoin is gaining ground relative to the rest of the crypto market.
Key Market Levels Traders Need to Watch
The headline S&P 500 remains resilient, but Gareth's framework says the more important information is underneath it.
Treasury yields are still controlling the short-term rhythm of equities. Mega-cap stocks are masking significantly greater weakness in the equal-weight market. That weakness, however, is beginning to create better-defined opportunities rather than simply adding bearish evidence.
The clearest example is RSP. $205 to $204.70 brings together former resistance, a gap fill and a 50% Fibonacci retracement in one zone. That is the type of alignment Gareth wants to see before putting capital to work.
Elsewhere, the same discipline applies. Gold has $4,100. Nike needs confirmation at support. Semiconductor investors need to watch the market's reaction to good news rather than the earnings headline alone. Bitcoin dominance is giving a clearer signal than Bitcoin's sideways price action.
The market requires levels. As yields move, quarter-end distortions unwind and several major charts reach technical decision points, the advantage comes from knowing where the setup improves, where it fails, and where doing nothing is still the better trade.
Trading involves substantial risk. All content is for educational purposes only and should not be considered financial advice or recommendations to buy or sell any asset. Read full terms of service.