My Trading Game Plan Revealed - 09/29/2026: 10-Year Yield 5.25% Showdown Sets Market Direction

The 10-Year Yield Is at 5.25%. This Is the Level Driving the Market Now
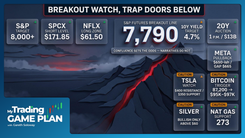
The S&P 500 may be sitting within roughly 2% of its all-time high, but that is not the chart carrying the most information right now. The more important setup is happening in the 10-year Treasury yield, which has rallied into major resistance around 5.25%, a level that traces back to the 2006-2007 period. How yields behave here could determine whether equities get another opportunity to push toward record highs or whether higher borrowing costs force another round of pressure across risk assets.
That makes 5.25% the line in the sand. The level has not broken yet, which means it still deserves respect as resistance. A rejection would give equities some breathing room, particularly if incoming economic data cools without collapsing. A decisive breakout would change that framework. Above 5.25%, the next technical area on the 10-year sits around 5.45% to 5.50%, creating another meaningful tightening impulse for financial conditions.
The Market Wants Weaker Data, But Not Weak Data
That yield setup makes this week's economic data more important than the headline numbers themselves. The market is still operating in a narrow zone where slightly weaker data can be bullish because it reduces pressure on rates, while significantly weaker data risks reviving recession concerns. The reaction function matters more than whether a report simply beats or misses expectations.
JOLTS is a good example. Job openings previously came in at 7.27 million, with consensus around 7.23 million for the next release. A print slightly below consensus, around 7.19 million, could fit the market's preferred scenario. It would show some cooling in labor demand without necessarily pointing to a sharp deterioration in the economy. A hotter number creates the opposite problem because it could put renewed upward pressure on the 10-year yield.
Consumer Confidence carries a similar setup. With the prior reading at 89.4 and expectations around 89.2, a modest miss could help the rate picture. A stronger reading, particularly around 90 or above, could reinforce the idea that the economy remains hot enough to keep yields elevated. The market is not simply trading whether the data is good or bad. It is trading whether the data gives the 10-year a reason to break 5.25%.
The S&P 500 Is Bullish, But Breadth Is Sending a Warning
The S&P 500 itself remains constructive despite yesterday's roughly 0.75% decline. The index is still close to its all-time high, and as long as it remains above the neutral zone identified on the chart, the broader bullish structure stays intact. There is also the potential for an inverse head and shoulders pattern that, if confirmed, would carry a measured move toward 8,000.
The weakness is underneath the index. More S&P 500 components are trading below their 50-day moving averages than above them, even with the index near record territory. That tells us leadership is narrow. Mega-cap names such as Microsoft, Meta, NVIDIA and CrowdStrike are doing more of the work while a larger portion of the market struggles underneath.
That does not invalidate the bullish S&P setup, but it changes the quality of the move. An index can continue higher on narrow leadership, especially when the largest stocks carry significant weight. The vulnerability appears if those leaders begin to weaken before participation underneath them improves. That is why breadth matters here as a warning rather than an automatic bearish signal.
Oil Is Helping, But Rates Are Not Fully Responding
WTI crude fell roughly 3.25% this morning, which should remove some inflation pressure at the margin. What stands out is that the 10-year yield has not fallen proportionally with oil. If energy were the market's primary concern, a move of this size in crude would normally be expected to provide more relief in rates.
That disconnect suggests the bond market is looking beyond oil. Debt issuance, economic resilience and the possibility that growth remains too firm are still part of the rate equation. In other words, lower oil helps the bullish case, but it has not yet solved the problem at 5.25%.
The oil chart itself remains weak. WTI is forming a bear flag, with the recent price action contained inside a downward-sloping channel. The next important support sits around \$90 per barrel. Continued weakness toward that area could further reduce inflation pressure, while a break below \$90 would open the door to additional downside unless a geopolitical or supply catalyst changes the structure.
Gold and Silver Are at Decision Levels
Precious metals are showing what happens when momentum breaks after an extended run. Gold has pulled back into support around 4,100 and is attempting to stabilize. That level matters because a failure of the current trendline would expose a deeper retracement zone around 3,700 to 3,800. Below there, the larger breakout area near 3,500 becomes relevant.
Silver has already suffered more technical damage and is testing support around \$60. If that level fails, the next area is roughly \$54 to \$55. The more interesting longer-term zone sits near \$50, where prior price structure converges with the 78.6% Fibonacci retracement measured from the 2025 low to the recent high.
The important point is not that silver must reach \$50. It is that multiple technical references begin stacking up there. When historical price support and a major Fibonacci retracement converge, that is where the chart becomes more interesting from a risk/reward standpoint.
Bitcoin Is Stronger, but Dominance Changes the Crypto Read
Bitcoin is showing better relative strength than several other major risk assets, but the Bitcoin Dominance chart is sending a separate message. Dominance has broken above a large wedge and has repeatedly held the breakout area on subsequent tests.
That does not automatically mean Bitcoin itself has to surge. Rising dominance can also occur because capital is leaving altcoins faster than it is leaving Bitcoin. In that environment, Bitcoin could remain relatively resilient while smaller cryptocurrencies experience substantially larger percentage declines.
For crypto traders, that distinction matters. The signal is less about an outright Bitcoin price target and more about where capital is concentrating inside the crypto market. As long as the dominance breakout holds, the relative-risk picture remains more difficult for altcoins.
Individual Setups: Let Price Come to the Level
Away from the macro picture, several individual stocks are approaching levels where the risk/reward becomes more defined. Carnival Cruise rallied following earnings, but chasing the initial move offers less structure than waiting for resistance. The first level is around \$24, followed by a stronger confluence near \$25.50, where prior pivot lows overlap with the 50% Fibonacci retracement. That is the area where a potential short setup becomes more interesting.
Boeing is approaching support around \$177.50 following its recent decline, creating a potential bounce area if buyers respond there. Aeon is also deeply oversold, with RSI near 20 and significant support below price. That does not guarantee a reversal, but the combination of stretched momentum and nearby support creates the conditions for the type of snap-back trade worth watching.
The common thread across these setups is patience. A stock moving sharply is not enough. The edge comes from waiting until price reaches a level where the chart defines the trade.
The Bottom Line
The market's game plan currently runs through one chart: the 10-year Treasury yield at 5.25%.
A rejection from that resistance, helped by slightly softer economic data and continued weakness in oil, would give the S&P 500 room to maintain its bullish structure and potentially challenge new highs. A confirmed break above 5.25% changes the equation and brings 5.45% to 5.50% into play, increasing pressure on equities and other risk assets.
The S&P remains constructive, but weak breadth means the index does not have much room for its largest leaders to stumble. Gold and silver are testing important support, Bitcoin dominance is warning of continued relative weakness in altcoins, and several individual stocks are approaching actionable technical levels.
There is no need to predict every move from here. Respect 5.25% until it breaks. Then let the reaction in rates tell you which market setup deserves your attention next.
Trading involves substantial risk. All content is for educational purposes only and should not be considered financial advice or recommendations to buy or sell any asset. Read full terms of service.