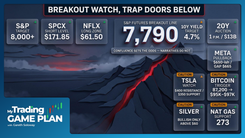
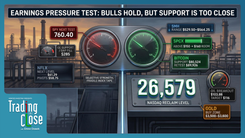
Trading The Close Market Recap - 09/24/2026: Yields Spike & Hormuz News Whipsaw Markets — S&P Trendline Holds, NatGas Breakout

The Headline Moved the Market. The Charts Told the Bigger Story.
Thursday's session gave traders plenty of reasons to focus on the headlines. A report that the Strait of Hormuz could be moving toward reopening sparked a sharp midday rally, only for Iran to deny the report shortly afterward. The result was what Drew Dosek described on Trading the Close: whiplash.
Despite the sudden burst higher from the rally the S&P 500 ran into the declining trendline extending from its recent highs and stalled. At the same time, the 10-year Treasury yield continued pushing higher. That combination leaves traders with a cleaner framework heading into the next session: equities have not cleared the technical resistance standing in their way, and yields remain the larger macro pressure point.
The S&P Rally Found Its Line in the Sand
Before the midday reversal, the S&P 500 had opened lower and spent the morning consolidating bearishly. Then came the Hormuz headline and a sharp rally around 12:10 PM.
Price rallied into the declining trendline Drew has been tracking from the index's recent highs and stalled there. That is why predefined technical levels become more useful when headlines start moving markets quickly. Traders do not have to predict the next geopolitical update. They can watch how price behaves when the news pushes the market into an important area.
As Drew explained during the show:
"When you draw these trend lines correctly, you can have price influenced by these trend lines in multiple days afterwards."
The rejection does not automatically make the broader market bearish. It does tell traders that the S&P has not yet proven it can break the short-term resistance structure.
The Nasdaq offered a slightly different signal. After reaching new all-time highs earlier in the week, the index retraced to roughly 26,700, near its prior breakout area, and held. That keeps the technology-heavy index technically stronger for now, but the combination of Nasdaq resilience and rapidly rising yields creates one of the more important divergences in the market.
The 10-Year Yield Is the Bigger Test
If there is one chart outside the major indexes that deserves traders' attention, it is the 10-year Treasury yield.
Yields have moved sharply higher over the past two sessions, with daily RSI reaching 75.69 and weekly RSI at 78.17 in Drew's analysis. Those readings show how extended the move has become, but an overbought reading alone does not mean yields have to reverse.
That distinction matters because equities, particularly technology stocks, have so far absorbed the rise in yields better than traders might normally expect.
Higher long-term yields can increase financing costs and raise the discount rate applied to future earnings. Yet the Nasdaq is still holding its breakout area, and the broader market has not suffered the type of breakdown that the bond move might suggest.
For traders, that makes the market's reaction to yields more important than the yield move by itself.
Drew identified 5.289% as the next major technical resistance area on the 10-year. Rather than assuming equities must break because yields are rising, the cleaner approach is to watch whether the S&P and Nasdaq continue absorbing that pressure or finally begin confirming it through weaker price structure.
That is the divergence to carry into the next session.
Semiconductors Give Traders Another Confirmation Point
The SMH semiconductor ETF reinforces the same idea.
Like the broader market, SMH opened lower and consolidated bearishly before the midday headline pushed price back toward its gap. But overhead resistance remains important, particularly around the 61.8% Fibonacci retracement at $607.58.
Drew also noted that the earlier decline did not reach the top of the parallel channel he is tracking. In other words, the cleaner retrace setup he was looking for never fully developed.
If SMH can work through $607.58 and hold above that area, the technical picture would improve. If it stalls there, the semiconductor ETF remains another example of a market capable of rallying without yet clearing the resistance that matters.
Oil Shows Why Headlines Need Confirmation
Oil provided the clearest example of why traders cannot rely on a chart pattern after the information driving price has changed.
Earlier in the session, U.S. oil had triggered a 30-minute inverse head and shoulders pattern with a potential move toward the $97.50 area. The Hormuz reopening report changed that setup almost immediately, sending oil sharply lower and disrupting the bullish intraday structure.
That does not make the original analysis wrong. It makes the invalidation part of the trade.
Oil subsequently developed a near-term bear flag, although long lower wicks showed buyers stepping in after the decline. On the daily chart, Drew highlighted approximately $97.43 as resistance, near the midpoint of the larger parallel structure.
The lesson is straightforward: patterns provide a framework, not a promise. When price invalidates the setup, the trader adjusts.
A Few Secondary Charts Worth Keeping on the Screen
Natural gas produced one of the cleaner breakouts of the session, moving above a declining trendline that had rejected several prior attempts. Drew referred to natural gas by its familiar "Widowmaker" nickname, a reminder of how quickly volatility can move against either side of the trade.
The next question is confirmation. Holding above the breakout area would strengthen the move, while a reversal back below it would weaken the signal. Drew's next larger technical area sits near the lower portion of the parallel channel below $3.60.
META is approaching a different type of test after its recent surge. The stock is moving toward its prior all-time-high area around $796.25, while Drew's weekly chart also places the 50% area of a longer-term parallel channel nearby. That creates a meaningful resistance zone approaching the psychological $800 level.
Rather than assuming META has to reverse there, traders can watch how price behaves when those technical factors converge. A rejection, consolidation, or clean breakout would each provide different information about the strength of the move.
Bitcoin remains another chart where confirmation matters. Drew is watching resistance in roughly the $88,000 to $89,000 region, with the larger neckline near \$89,021 and support around $80,594. Until either boundary gives way decisively, Bitcoin remains inside the broader structure rather than in a confirmed breakout.
What Traders Should Watch Next
Thursday's session was noisy, but the framework coming out of it is relatively simple.
The S&P 500 absorbed a sharp geopolitical headline and rallied, but the move stopped at declining technical resistance. The Nasdaq continues to hold its recent breakout area. Semiconductors bounced but still face an important Fibonacci barrier. Meanwhile, the 10-year yield remains elevated enough to test how much macro pressure equities can continue to absorb.
That creates several useful confirmation points for the next session.
The first is whether the S&P can finally clear its declining trendline or continues rejecting it. The second is whether the Nasdaq can defend the 26,700 breakout area. The third is whether the 10-year yield continues toward Drew's 5.289% resistance level or begins cooling after its recent surge.
Those signals matter more than trying to predict the next headline.
Bottom Line
The big lesson from Thursday was not that geopolitical news can create volatility. Traders already know that.
The more useful takeaway was that even during a fast headline-driven reversal, the market still gave traders defined areas where the risk/reward changed. The S&P rallied into resistance and stopped. Nasdaq held its breakout area. SMH bounced into another technical barrier. Oil demonstrated what an invalidated setup looks like in real time.
That is where Drew's framework becomes useful.
The goal is to know the levels that matter before the headline arrives, then let price confirm or invalidate the setup.
Trading involves substantial risk. All content is for educational purposes only and should not be considered financial advice or recommendations to buy or sell any asset. Read full terms of service.