My Trading Game Plan Revealed - 09/25/2026: Yield Curve Risks, Semiconductors Lead, Oil Tech and Bitcoin Key Levels

Falling Yields Give Stocks Relief, but These Technical Levels Still Need to Break
The market opened Friday with another reminder that headlines can move price quickly, but they do not automatically change the technical picture. Drew Dosek, filling in for Gareth Soloway on My Trading Game Plan, pointed to falling Treasury yields and renewed discussion around a potential phased reopening of the Strait of Hormuz as the immediate catalysts. The more important question for traders is what happens after that initial reaction. Across the S&P 500, semiconductors, oil and several individual names, price is sitting near levels that can either confirm the move or expose it as another short-term reaction.
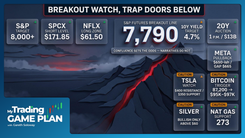
That makes yields one of the most important pieces of the setup. The 10-year yield recently broke out of consolidation and cleared the 5.021% area dating back to 2023 before reaching roughly 5.177%. Drew’s focus is not simply on whether yields rise or fall on a given headline. He is watching how the entire curve behaves and whether relief at the long end is actually being confirmed elsewhere.
The Yield Curve Is the Macro Signal Behind the Headlines
The Strait of Hormuz remains an important variable because of its potential impact on oil and inflation expectations. Drew noted that reports of a possible phased reopening helped yields pull back Friday morning, but he also questioned how durable that relief could be if negotiations fail to produce a lasting agreement. In his framework, the geopolitical story matters primarily through what it does to oil, inflation expectations and ultimately Treasury yields.
There is also an important divergence developing inside the yield curve. Drew highlighted the 2-year yield around 4.89% against the 10-year near 5.177%. Since August 25, he noted that the 10-year had risen roughly 13% while the 2-year had climbed about 18.2%. That faster move at the short end is what makes the spread worth watching.
If the 2-year eventually moves above the 10-year, the curve would invert. Drew pointed to inversion as a historically important recession warning rather than an immediate recession signal, with the economic implications potentially arriving months after the initial inversion. For traders, that distinction matters. The signal is not a reason to react to one trading session. It is a change in the macro framework that would need to be incorporated into positioning over time.
Stocks Are Bouncing, but SMH Has the Cleaner Confirmation Level
Against that macro backdrop, the S&P 500 is trying to recover from Thursday’s failed attempt to hold above its declining trend line. The index was pushing higher in Friday’s premarket session, putting the bulls back in position to test the breakout. Drew identified 768.54 as the level that matters for confirmation. A daily close above it would strengthen the near-term bullish setup, particularly if oil and Treasury yields remain contained.
The Nasdaq 100 is facing a similar test. QQQ is pressing against resistance near \$748.65, and a daily close above that area would improve the technical structure. But Drew’s preferred read on broader risk appetite comes from semiconductors.
“I see the SMH as being the leading indicator for risk-on sentiment in the markets.”
SMH has already cleared a declining trend line from its all-time high and broken above the upper boundary of the parallel channel that had contained price since the April 2025 lows. Now it is testing the 61.8% Fibonacci retracement at \$607.58. That gives traders a clean decision point. A daily close above \$607.58 would strengthen the breakout and put \$635.84 into play as the next major resistance area. Failure there would leave the recent move without the confirmation Drew wants to see.
That is the more useful read on Friday’s equity bounce. The headline may create the initial move, but SMH can help show whether risk appetite underneath the market is actually improving.
Oil Shows Why the Chart Still Comes First
Oil provided one of the clearest examples from Drew’s session of price reaching an important technical level before the narrative caught up. Crude had been moving higher inside an inclining parallel channel before reaching the channel’s 50% midline. Price began rejecting that resistance around the same time reports emerged about a possible phased reopening of the Strait of Hormuz.
The sequence reinforces Drew’s broader framework. The headline helped explain the catalyst, but the resistance level was already visible on the chart. Traders did not need to predict the geopolitical development to know where price could run into trouble.
The larger oil structure remains important. Drew is tracking an inverse head and shoulders pattern with a declining neckline overhead. A confirmed breakout would produce a measured-move target above \$116. Until that neckline breaks, however, the target remains conditional. A breakdown in Strait negotiations could become a catalyst for another move higher, but price still has to confirm the technical setup.
Natural gas is further along in its breakout. Price continues to hold above a major pivot from March, although daily RSI reached the 70 area Thursday, signaling that the move has become extended in the near term. Drew continues to view pullbacks within the existing structure as potential opportunities, with the lower boundary of a longer-term parallel channel around \$3.56 serving as the next major upside level.
Gold and Silver Are Trying to Repair Their Structures
Gold and silver are also sitting at technical decision points, but the two metals are not giving the same signal. Gold recently slipped beneath the lower boundary of its parallel channel from the April 2025 lows. For the bullish structure to repair itself, Drew wants to see gold reclaim that channel, with \$4,347 marking an important area in that process.
Silver has shown better relative strength, but it still needs confirmation. Drew identified \$64.62 as the key level, where price is testing an inclining trend line left over from a failed head and shoulders formation. A daily close above that area would strengthen the near-term bullish case. Until then, strength alone is not the same thing as a confirmed breakout.
Tesla and Meta Show the Risk of Chasing Extension
Some of Friday’s most useful lessons came from stocks that are moving higher rather than breaking down. Tesla is drifting up with the broader market, but Drew sees a less attractive structure as price approaches \$400. The stock has not built the cleaner stair-step pattern of advance, consolidation and another advance that he prefers to see in sustainable trends.
The \$400 area also carries more than psychological significance. Trend lines drawn from the April 2025 lows converge around that region, creating what Drew described as an “X marks the spot” resistance area. The issue is therefore not whether Tesla can continue higher in the short term. It is whether the risk/reward remains attractive as price approaches converging resistance without first consolidating.
Meta presents an even clearer example. Price is approaching a triple-top region near \$795, while the midpoint of a parallel channel dating to December 2023 sits close by around \$798. At the same time, daily RSI has reached 80.51, putting momentum deep into overbought territory.
That does not automatically mean Meta has to reverse. It does mean the setup has changed. After a strong run into multiple resistance factors, chasing the move offers a very different risk/reward profile than buying after a pullback or consolidation that allows momentum to reset.
Fastly and Bitcoin Still Need the Breakout
Fastly offers the opposite setup: a chart where the larger move has not happened yet. FSLY has formed a sizable inverse head and shoulders pattern with neckline resistance at \$29.83. A daily close above that level would confirm the breakout and activate a measured-move target around \$46.33.
The weekly chart adds to the setup because there is relatively little nearby technical resistance immediately above the neckline. But the sequence still matters. The pattern itself is not the trade confirmation. The break above \$29.83 is.
Bitcoin is operating under the same principle. Price continues to consolidate beneath \$88,948, the neckline from its previous head and shoulders structure. Drew sees that level as the point that could materially change the technical read. A confirmed break above it would weaken the prior bearish structure and open the door toward the midpoint of Bitcoin’s broader parallel channel, with resistance around \$104,000.
Until that happens, Bitcoin remains below the level that would force a reassessment.
Bottom Line
Friday’s headlines are providing relief to yields, oil and equities, but Drew’s game plan does not depend on predicting whether the Strait of Hormuz negotiations succeed or what the next headline will say. The charts already provide the levels where the market has to prove that the underlying structure has changed.
For equities, SMH at \$607.58 is one of the cleanest risk-on confirmation levels on the board. The S&P 500 and QQQ also have resistance directly overhead, while Tesla and Meta show why strength can become less attractive when price reaches major resistance in an extended condition. Oil, Fastly and Bitcoin tell the same story from different directions: the setup may be there, but confirmation still has to come from price.
That is the game plan heading into the next move. Let the headline create volatility. Let the chart determine whether that volatility actually changes the trade.
Trading involves substantial risk. All content is for educational purposes only and should not be considered financial advice or recommendations to buy or sell any asset. Read full terms of service.