Trading The Close Market Recap - 09/28/2026: Yields Surge to 5.27% While Stocks Hold — Nvidia Buyback & SpaceX Lock‑Up Pressure

Yields Hit 2007 Levels, But Stocks Aren’t Breaking Yet
The 10-year Treasury yield pushed above 5.25% into the close, reaching levels last seen in 2007. That should be a major problem for stocks. Higher yields raise borrowing costs, pressure valuations, and give investors an increasingly attractive alternative to equities.
But the more important signal from Monday’s session was what didn’t happen.
Stocks did not break the way traders might expect with yields at these levels. The S&P 500 slipped, but the Nasdaq held its breakout structure and semiconductors continued to consolidate constructively. For Pro Trader Drew Dosek, that disconnect matters more than the headline yield itself.
“The selling is not what we could anticipate,” Drew said. “It tells us the markets aren't really too scared about the high yields per se right now.”
That does not make the yield spike irrelevant. It means traders need confirmation before assuming higher rates automatically translate into a larger equity selloff. Right now, the bond market is flashing stress while important areas of the stock market are refusing to confirm it.
The 10-Year Is Reaching a Decision Zone
The 10-year yield climbed as high as 5.274%, putting it just beneath Drew’s next major resistance level at 5.289%. That area carries historical significance because yields have not traded there since June 2007.
The comparison matters as a technical reference, not as a prediction that 2007 is about to repeat. The more useful question is what yields do when they reach a level the market has not tested in nearly two decades.
Momentum is already stretched. RSI sits at 69.07 on the monthly chart, 78.61 on the weekly, and 73.6 on the daily. That does not guarantee an immediate reversal, but it tells traders that the move has become extended across several timeframes.
That creates the first major watchpoint for equities.
If the 10-year stalls around 5.289% and begins consolidating or pulling back, one of the market’s biggest current headwinds starts to ease. If yields continue breaking higher instead, stocks will have to prove how much rate pressure they can actually absorb.
Until one of those scenarios develops, the lack of aggressive equity selling remains part of the signal.
Stocks Are Bent, Not Broken
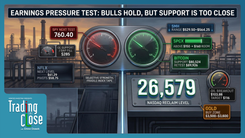
The S&P 500 closed down 0.74% and slipped below its declining trend line, so the index has not escaped the pressure completely. Near-term support sits around 760.36, an important pivot tied to the previous all-time-high area. On the upside, Drew is watching 767.99 as the level bulls need to reclaim to strengthen the setup.
The Nasdaq is holding up better.
It remains above key support at 26,691 and has preserved its broader breakout structure despite the jump in yields. That resilience is constructive, but Drew does not want to see price repeatedly lean on the same level.
“The more and more you hit any support trend line, the more and more likely price will go through it,” he explained.
That makes 26,691 more than just another support number. Bulls want separation from it. A move higher while yields begin cooling would keep 28,000, where psychological resistance meets an inclining trend line, in play.
The distinction for traders is simple: the macro backdrop looks increasingly uncomfortable, but price has not yet confirmed the bearish interpretation.
Semiconductors Reinforce the Divergence
Semiconductors provide another reason not to treat the yield spike as an automatic risk-off signal.
SMH fell roughly 1%, but its broader technical structure remains constructive. The ETF has broken above a declining trend line, moved through the top of an inclining parallel channel, and reclaimed its 50-day moving average. Its 20-day moving average is also curling above the 50-day.
Instead of immediately failing after those moves, SMH is consolidating beneath 61.8% Fibonacci resistance at \$607.58.
That is the level that matters now. A confirmed push through \$607.58 would keep the bullish structure intact and bring \$635.54 into view. Failure would put more emphasis back on the breakout levels underneath.
NVIDIA is telling a similar story.
The stock gained 1.68% following the announcement of a \$150 billion share buyback authorization, but Drew’s focus remains on the chart rather than the size of the headline. NVIDIA continues making higher lows while approaching stacked resistance at \$234.70 and \$239.68.
“The near-term trend on NVIDIA is not bad at all,” Drew said. “It's making higher lows on the chart, but we got stacked resistance approaching.”
That is exactly the type of setup where confirmation matters. Higher lows show buyers continuing to step up, but resistance still has to break. If NVIDIA can clear that zone, \$240 becomes the immediate area to watch rather than something traders need to anticipate before price gets there.
Where Higher Yields Are Actually Doing Damage
The resilience in equities becomes more meaningful when compared with assets that are reacting aggressively to higher yields.
Gold dropped 3.87% and broke beneath the inclining parallel channel that had supported its advance since April 2025. Near-term support now sits around \$4,104, with the recent lows around \$3,946 becoming increasingly important if sellers remain in control.
The first bounce may also be revealing. Once support breaks, that same trend line can become resistance on a back-test. Rather than assuming gold immediately recovers, Drew’s framework is to watch how price reacts if it returns to the underside of the broken structure.
Silver suffered even more damage, falling 5.56% and breaking out of its previous consolidation area. It is now testing support around \$58.82, while Drew sees \$52 as a more significant downside level if the breakdown continues.
This is where Monday’s market gets interesting. Higher yields clearly matter. Precious metals are showing that. The question is why the same pressure has not produced comparable technical damage across the major equity indexes.
Until it does, traders should respect the divergence instead of forcing every asset into the same macro narrative.
SpaceX Shows Why Supply Can Matter More Than the Story
SpaceX offered a different lesson, one centered on market structure rather than macro conditions.
Drew focused on the scheduled release of previously restricted shares and the potential supply those shares can introduce into the market. The company recently saw 328 million additional shares become available, with further releases expected in October, late October into early November, and December.
That potential supply matters because price has already lost near-term support at \$149.91.
Rather than chasing weakness, Drew is looking lower. His preferred area sits between \$125.19 and \$131.48, where the chart could offer a more attractive risk-reward setup after additional supply has had time to work through the market.
There is also a larger pattern developing. If price stabilizes in that zone, it could form the right shoulder of an inverse head and shoulders setup with a measured-move target around \$212.
The trade is not the pattern today. The trade is waiting to see whether price reaches the area where that pattern can actually develop.
Tesla carries a similar lesson. The stock broke its near-term uptrend and now needs to reclaim \$369.42 to repair the immediate technical damage. If it cannot, \$342.11 becomes the next support area Drew is watching. A hold there could also contribute to a larger inverse head and shoulders structure, but resistance around \$385 and \$410 would still need to be cleared before the bullish case strengthens.
Both setups reinforce the same discipline: location first, confirmation second, target third.
Energy Rewards the Same Patience
Crude oil remains above the neckline of its larger inverse head and shoulders pattern. As long as that structure holds, Drew continues to watch the measured-move target around \$116.19.
Natural gas is giving traders an even cleaner example of why chasing breakouts can create poor entries.
After a sharp move higher, natural gas failed to hold above \$3.23 and began retracing. Drew is watching approximately \$3.08 as the preferred area for buyers to prove themselves again. A successful hold there would keep the path toward \$3.60 open.
The important part is not simply that natural gas remains bullish or bearish. It is that the setup improves if price comes back to a predefined level rather than forcing traders to chase an extended move.
Individual Stocks Show the Value of Confirmation
MongoDB and Procter & Gamble rounded out the session with two very different examples of how catalysts interact with technical structure.
MongoDB fell 18.46% following a leadership change ahead of its Investor Day. Whatever the market ultimately decides about that change, the chart has already registered the uncertainty through price. Drew is watching \$339.57 as the first meaningful level the stock would need to reclaim before the technical damage begins to improve, followed by the \$355 pivot.
P&G moved in the opposite direction, gaining 1.91% as it pushed through a declining trend line after several attempts.
That puts the stock on breakout watch, but the move still needs confirmation. A daily close above the recent highs would strengthen the breakout and bring \$153.06 into focus, followed by a broader channel target around \$157.
Again, the framework is the same. A technical level creates the setup. Price behavior at that level determines whether traders actually have confirmation.
Bottom Line: Watch What the Market Does, Not What It Should Do
The 10-year yield above 5.25% is the obvious headline. The better trading signal is that stocks have not responded the way many traders would expect.
That can change quickly.
The S&P 500 still has work to do. Nasdaq support at 26,691 cannot withstand unlimited tests. SMH still needs to clear \$607.58, and NVIDIA is approaching stacked resistance. If those structures begin failing while yields continue higher, the bond market’s warning will finally have confirmation from equities.
But that confirmation is not there yet.
For now, Drew’s framework is built around watching the reaction rather than trading the assumption. A rejection in the 10-year near 5.289% could relieve pressure on equities. Continued strength in the Nasdaq and semiconductors would reinforce the market’s resilience. A breakdown through their key supports would tell traders that higher yields are finally transmitting into equity price action.
That is the real setup heading into the next session: yields are flashing the warning, but price still gets the final vote.
Trading involves substantial risk. All content is for educational purposes only and should not be considered financial advice or recommendations to buy or sell any asset. Read full terms of service.