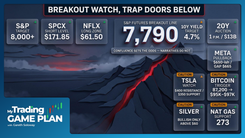
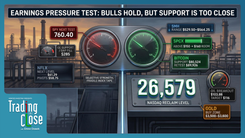
Trading The Close Market Recap - 09/29/2026: 10-Year Yield Surge Tests Markets — Equities Hold; IWM & Semiconductors Poised for Rebound

10-Year Yield Breaks 2007 Highs, but Stocks Refuse to Break
The biggest move into Tuesday's close was not in stocks. It was in the bond market.
The 10-year Treasury yield pushed as high as 5.293%, breaking above its June 2007 high. Normally, that kind of move would be expected to put significantly more pressure on equities, particularly growth stocks and other rate-sensitive areas of the market. Instead, the S&P 500 and Nasdaq bent without breaking.
That resilience was the most important signal Drew Dosek highlighted on today's Trading the Close. The headline is that yields are making historic highs. What matters more for traders is that stocks are absorbing the pressure better than expected while the 10-year itself is becoming technically stretched.
That creates a straightforward setup heading into the next round of economic data: if yields continue higher, equities may finally have to respond. If yields consolidate or pull back from overbought conditions, the pressure that has been sitting on stocks could begin to ease.
The 10-Year Is Testing the Market, but Stocks Are Holding
The 10-year yield reached 5.293%, pushing through the June 2007 high and into territory the market has not dealt with in nearly two decades.
Higher yields matter because they tighten financial conditions, raise borrowing costs and give investors a more competitive alternative to equities. The important question, though, is not whether higher yields should pressure stocks. It is whether they actually are.
So far, the reaction has been relatively controlled.
"You would anticipate the markets actually pushing and pulling down lower, but they didn't."
SPY finished down just 0.18% at \$764.20 and never reached the declining trend line it had interacted with in five of the previous six sessions. If selling picks up, Drew is watching the previous pivot high around \$760.40 as the next important support area.
The Nasdaq showed a similar response. It pulled back but avoided testing its declining trend line. Drew wants to see the index create more separation from that support, with a move back toward 27,000 strengthening the bullish structure and potentially opening the door toward 28,000.
That does not mean rising yields suddenly do not matter. It means the equity market has not confirmed the bearish message coming from bonds.
That distinction becomes more interesting when looking at the yield chart itself.
The daily RSI on the 10-year has moved above 70, putting it into overbought territory, while the latest daily candle showed a relatively narrow body after the recent push. Drew's working range is roughly 5.021% to 5.289%. A period of consolidation inside that area, or a pullback toward the lower end, could take some pressure off equities.
The next move in yields matters more now than simply the fact that they reached a new high.
Small Caps Show Where Higher Yields Are Actually Hurting
The Russell 2000 ETF, IWM, gives traders a cleaner look at how the rate environment is being transmitted into equities.
Small-cap companies tend to be more sensitive to financing conditions, and IWM has been moving lower as yields have pushed higher. Unlike the relative resilience in SPY and the Nasdaq, this is an area where the pressure is much easier to see.
But price is also approaching an interesting technical zone.
IWM has remained inside a parallel channel dating back to the April 2025 lows, with the lower boundary approaching \$274.52. Just beneath it, the 50% Fibonacci retracement from the March 2026 low comes in around \$271.94, near a prior January pivot high. Daily RSI has also fallen to 31.05.
That gives Drew a cluster of factors rather than a single support line.
"We have a yield heavy-stressed index right here with the IWM, and it's coming down with the yields going up, getting to a place of potential support."
The \$271.94 to \$274.52 area is therefore worth watching if IWM continues lower. More importantly, the setup connects directly back to the day's main macro signal. If yields begin to cool while IWM reaches that support cluster, the technical and macro pieces would start lining up at the same time.
That is a much stronger setup than buying simply because RSI is approaching oversold.
Semiconductors Are Waiting for Their Catalyst
Semiconductors are dealing with a different problem: price is consolidating near resistance while traders wait for a catalyst.
SMH remains around its 61.8% Fibonacci retracement at \$607.58. It traded above that level intraday but failed to secure the daily close Drew wants to see for confirmation.
The larger structure remains constructive following breakouts from a declining trend line and parallel channel, but the sector still needs to prove it can clear resistance.
That makes the upcoming Micron earnings report particularly important.
STX and WDC are consolidating near declining trend lines, while SNDK has already broken its trend line and spent the past two sessions holding above the breakout area. Rather than treating those as three separate trades, Drew's framework is to watch whether Micron provides the catalyst that confirms or rejects the broader semiconductor setup.
Strong guidance could help pull the group through resistance. A negative reaction would put the recent breakouts at risk and force traders to reassess the structure.
The charts are already in position. Now they need confirmation.
Natural Gas Reinforces Drew's Rule: Do Not Chase
Natural gas provided one of the clearest trading lessons of the session.
After attempting to push higher without confirming a breakout above its declining trend line, natural gas reversed sharply. Price ultimately came back toward previous consolidation support.
For Drew, the lesson was less about predicting the selloff and more about entry discipline.
"Be patient, sit back, sit on your hands. You don't need to buy a breakout. Wait for price to come back into support."
That is especially important in a volatile market like natural gas. Buying an initial push through resistance can leave a trader with poorly defined risk if the breakout fails. Waiting for price to return to support allows the chart to prove whether buyers are actually there.
If the current support area fails, Drew's next level is around \$2.99.
The same principle applies well beyond natural gas: a setup does not become better simply because price is moving quickly. Often, the better trade comes after the excitement fades and price returns to a level where risk can actually be defined.
Gold, Silver and Oil Still Need Confirmation
Elsewhere in commodities, the charts remain mixed.
Gold bounced following the prior session's breakdown as yields eased from their intraday high, but the bounce left unfinished business on the chart. Drew is watching the overhead trend line and the \$4,104 area to determine whether the move can develop into something more meaningful.
Silver reclaimed the \$61.30 area after breaking through support the previous session. The next test sits near \$63. A rejection there would keep Drew cautious and leave open the possibility of a larger retracement, while a clean break would force a reassessment of the near-term bearish setup.
Oil also continues to move lower and is approaching the bottom of its parallel channel near \$87.73. As long as the larger declining trend-line breakout remains intact, Drew's broader measured-move target around \$116 stays on the chart. For now, however, support matters before the target does.
That is the common thread across all three: do not trade the destination before price confirms the next step.
DraftKings Shows What "Stacking Factors" Actually Means
One of Drew's more interesting individual setups came from DraftKings, which fell 7.42% and is approaching a technically important support area.
The level Drew is watching is approximately \$19.15.
What makes it interesting is not the price alone. A longer-term trend line is approaching the same area, the 78.6% Fibonacci retracement from the 2022 low sits at \$19.15, and daily RSI has fallen to 29.15.
"I don't like to just take one-factor trades. I want to have those factors stacked in my favor."
That sentence gets to the heart of Drew's process.
A Fibonacci level by itself is not enough. An oversold RSI by itself is not enough. A trend line by itself may not be enough. When several independent technical factors begin converging around the same price, however, the area becomes much more useful for defining a potential trade.
Even then, support is not guaranteed to hold. The weekly RSI remains around 34, leaving room for price to briefly push through the level before finding buyers. The point is not to predict the exact bottom. It is to identify an area where the risk and potential reward become clearer.
Other Setups on Drew's Radar
Several other stocks are reaching decision points, but they remain secondary to the broader yield story.
CarMax gave back most of its post-earnings advance and closed at \$59.23 despite strong reported results. The stock had already broken a multi-year declining trend line, so the question now is whether it can consolidate above the old downtrend rather than falling back inside it. The reaction around the \$64 area showed that overhead supply remains meaningful.
LITE is also testing a major declining trend line after repeated attempts to break through it. Drew counted nine tests, making the current close above the line worth watching for confirmation. A confirmed breakout followed by a controlled retest would be more compelling than chasing the initial move.
BE, meanwhile, gave back a move above \$300 and closed at \$291.25, but its larger consolidation remains intact. Repeated tests of resistance near \$314.94 are the key. If price eventually clears that area and holds, Drew's parallel-channel work points toward \$400.
Different charts, same process: identify the level, wait for confirmation, and define the trade before committing capital.
What Traders Should Watch Next
The next session comes down to whether the relationship between yields and equities begins to change.
The 10-year has already delivered the headline by breaking its 2007 high. Now traders need to see whether it can extend that move or whether overbought conditions finally produce consolidation. If yields cool while SPY and the Nasdaq continue holding support, the resilience equities showed today becomes more meaningful.
IWM is particularly important because it provides a clearer read on rate sensitivity. A move into the \$271.94 to \$274.52 support zone alongside easing yields would create the type of multi-factor setup Drew looks for.
The upcoming inflation and employment data add another variable, but the charts provide the framework before those numbers arrive.
The market does not need to predict the data. It needs to react to it.
Bottom Line
The 10-year yield breaking above its 2007 high was the biggest headline of the session. The more useful signal was what didn't happen afterward: equities did not break with it.
That resilience should not be confused with an all-clear. If yields continue pushing higher, pressure on stocks can still build quickly. But with the 10-year technically stretched and major indexes still holding structure, the next move in yields could determine whether today's equity resilience was temporary or the beginning of another push higher.
Drew's approach remains the same across the market. Do not chase the first move. Wait for price to reach the level. Stack multiple factors when possible. Then let confirmation determine whether there is actually a trade.
That is especially important now, because the biggest opportunity may not come from predicting what happens next. It may come from being patient enough to let the market show it first.
Trading involves substantial risk. All content is for educational purposes only and should not be considered financial advice or recommendations to buy or sell any asset. Read full terms of service.