Trading The Close Market Recap - 09/30/2026: 10-Year Yield Surge vs. Tech Breakouts — Key Levels to Watch

S&P 500 Holds Firm Despite Rising Yields and Mixed Economic Data
The final print made Tuesday look weaker than it actually was.
The S&P 500 finished down 0.21% after selling accelerated during the final 10 minutes of trading. Taken by itself, that close suggests another session where rising Treasury yields and renewed rate concerns pressured equities. But that misses what Drew Dosek saw as the more important signal during Tuesday's Trading the Close: stocks spent most of the session absorbing those pressures remarkably well.
That resilience matters because the macro backdrop was anything but clean. A hotter-than-expected ADP jobs report added to concerns that the Federal Reserve may have more work to do, while cooler PCE inflation data pushed in the opposite direction. GDP also came in better than expected. Meanwhile, the 10-year Treasury yield pushed beyond its 2007 highs.
Normally, that combination would give equity traders plenty of reasons to sell. Instead, the market held together until the final minutes.
"If you flipped up just to look at the markets at the very end of the day, you would have said, oh, it was a red day. But guys, that was just one 10 minute candle."
That is the distinction traders need to carry into the next session. The close was weak. The structure underneath it was considerably more resilient.
The 10-Year Yield Tests a Critical Technical Zone
The biggest test for that resilience remains the 10-year Treasury yield.
Higher yields create a tougher backdrop for equities, particularly growth and technology stocks whose valuations are more sensitive to interest rates. With the 10-year pushing through levels not seen since 2007, equities are being forced to prove they can continue higher despite increasingly restrictive conditions.
Drew's chart, however, is beginning to show the first technical reason to watch for a pause.
The 10-year has developed what Drew calls a "Sleeper Hold," a technical pattern that previously appeared near the top in semiconductors earlier this year. Combined with an overbought daily RSI, the setup does not guarantee that yields have topped. It does tell traders that chasing the move higher becomes increasingly risky.
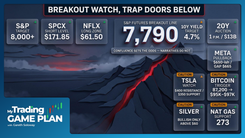
Drew is watching roughly 5.021% to 5.289% as the important range. Consolidation inside that zone would matter beyond the bond market because it could remove one of the biggest immediate headwinds facing equities.
That makes yields the transmission mechanism for the broader setup. If the 10-year finally cools while equities continue holding their technical breakouts, the market gets breathing room. If yields continue accelerating instead, Tuesday's resilience gets a much harder test.
Semiconductors Hold Key Breakout Levels Despite Rising Yields
The semiconductor sector offered one of the clearest examples of that resilience.
SMH has broken above both a declining trend line from its all-time high and the upper portion of an inclining parallel channel. Price then ran directly into the 61.8% Fibonacci retracement, creating a logical resistance area rather than an arbitrary stopping point.
Drew compared the structure to bumpers in a bowling lane. The levels give traders boundaries for where price should react and where the next decision gets made.
That is especially useful here because SMH does not need to blast through resistance immediately for the setup to remain constructive. What matters is whether buyers can defend the breakout structure underneath it.
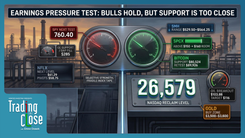
The NASDAQ is telling a similar story. Drew highlighted 26,672 as an important support area while the index continues holding above a declining trend line and near the top of a parallel channel that has been developing since April and May.
For now, technology is not behaving like a market overwhelmed by higher rates. It is behaving like a market testing whether it can digest them.
That is a much more useful signal than Tuesday's slightly red closing print.
Silver Approaches a High-Confluence Support Zone
Silver provided one of the cleaner examples of Drew's approach to trade location.
After breaking the neckline of a large head and shoulders pattern, the measured move points toward approximately \$53.15. But Drew is not treating that number as a magic level. Below it sits another important support area around \$50.14, where multiple prior pivots create additional confluence.
That turns the area into a zone rather than a single price.
Drew's framework is straightforward: below \$52.50, silver becomes increasingly interesting on the long side.
The lesson is not simply that silver could bounce. It is that a trader does not need to chase an asset to participate in the next move. Once the chart identifies where the risk-reward becomes more attractive, the job becomes waiting for price to come into that area and then evaluating the reaction.
Oil presents another constructive commodity setup. US Oil continues building an inverse head and shoulders pattern, with the larger measured move pointing toward \$116 as long as the structure remains intact. Drew identified \$88.14 near the bottom of the parallel channel as an important support area.
Natural gas is showing the opposite lesson.
A strong breakout candle produced no meaningful follow-through, and price subsequently rolled over as higher inventories and expectations for a mild winter weighed on the market. Support now sits around \$3.08, with resistance near \$3.23.
A breakout is information. Follow-through is confirmation. Natural gas delivered the first without the second.
Jabil Shows Why Good Earnings Are Not Enough
The same principle showed up in individual stocks.
Jabil reported a strong quarter, beating EPS estimates by 8.16% and revenue estimates by 9.3%. Yet the stock sold off and lost an important long-term inclining trend line.
That is why traders cannot stop at the earnings headline.
Drew mapped the March 30 pivot low to the recent high using Fibonacci retracements and identified \$281 to \$284.51 as the first major support zone. Jabil traded as low as \$284.39 Tuesday, putting price directly into that area.
Now the reaction matters.
If buyers defend the zone, the stock has a technical path back toward \$300. If the area fails, Drew is watching the open gap between approximately \$273 and \$266 as the next downside magnet.
Conagra offered another version of the same lesson. After breaking support, the stock rallied back into the underside of its broken trend line and was rejected, a classic breakdown-retrace setup.
The notable part was where that resistance came from. Drew traced the level back decades, including pivots around 1987 and the 2008 financial crisis. With price rejecting there again, \$11.78 becomes the next major support area on his chart.
The age of the trend line is less important than the behavior around it. Price reached a known area, sellers appeared, and the rejection confirmed that the level still mattered.
Quarter-End Positioning Pushes Market Leaders Higher
There was one additional wrinkle Tuesday: it was the final trading day of the quarter.
That matters because institutional portfolio positioning can distort price action around quarter-end. Fund managers may add recent winners or reduce laggards as they adjust reported holdings, creating flows that are not necessarily driven by a new fundamental view.
Drew pointed to HPE and P&W as examples of stocks pressing into or through all-time highs during the session.
For HPE, the challenge is that price discovery leaves fewer obvious horizontal resistance levels. Drew instead focused on a major trend line stretching back to March 2018, with \$58.19 as an important near-term support level if the quarter-end momentum fades.
P&W also broke above its previous highs, with Drew watching approximately \$426.62 around the midpoint of its longer-term parallel channel and heavier resistance extending toward \$435.
The takeaway is not that every late-quarter breakout should be faded. It is that traders should understand the source of demand before assuming today's momentum automatically carries into tomorrow.
What Traders Should Watch
Tuesday's late selloff changed the appearance of the daily candle, but it did not erase the more important message from the session.
Equities absorbed conflicting economic data and a 10-year Treasury yield pressing beyond its 2007 highs without giving up their broader technical structure for most of the day. Semiconductors remain above key breakout levels. The NASDAQ continues holding support. Several commodity and individual-stock setups are approaching clearly defined decision zones.
Now those levels have to hold.
The next macro test is ISM manufacturing PMI, followed by non-farm payrolls. Drew's framework going into those releases is less about predicting the number and more about watching how price responds to it.
If yields begin consolidating while the NASDAQ and semiconductors defend their breakouts, Tuesday's late selling may prove to be more noise than signal. If yields keep accelerating and those equity supports begin to fail, the market will be sending a different message.
That is why the closing print alone was not enough.
10-Year Treasury Yield Approaches Key Resistance
Tuesday was a good reminder that where the market closes matters, but how it got there can matter more.
The S&P 500 ended slightly lower, yet equities spent most of the session absorbing a difficult combination of rising yields and conflicting economic data. That resilience remains intact until the technical levels underneath it begin to break.
For Drew, the job now is not to guess what happens next. It is to watch the 10-year, respect the breakout levels in technology, and let price come into predefined trade zones rather than chasing movement.
One 10-minute candle can change the color of the day. It does not automatically change the structure of the market.
Trading involves substantial risk. All content is for educational purposes only and should not be considered financial advice or recommendations to buy or sell any asset. Read full terms of service.