My Trading Game Plan Revealed - 10/02/2026: Jobs Miss Spurs Rally as 10-Year Yield Tops Nike Dump and Oil at Risk

Weak Jobs, Falling Yields and the S&P 500’s Path Toward 8,000
The September jobs report looked ugly on the surface. Nonfarm payrolls increased by just 29,000, unemployment ticked up to 4.2%, and average hourly earnings rose only 0.1% for the month. Yet S&P 500 futures rallied sharply after the release.
That reaction tells you what matters more than the headline.
The market is not simply trading weaker employment. It is trading what weaker employment could mean for interest rates, Treasury yields, and ultimately equity valuations. That was the central framework in this morning’s My Trading Game Plan Revealed: if the labor market continues to cool without falling apart, pressure on the Federal Reserve to raise rates immediately decreases. At the same time, the 10-year Treasury yield is showing its first meaningful rejection from a major multi-decade resistance zone.
For Gareth Soloway, that keeps the broader equity setup bullish. The S&P 500 remains pointed toward roughly 8,000 unless the chart begins showing evidence that the structure has changed.
Why Did Stocks Rally After a Weak Jobs Report?
September nonfarm payrolls increased by only 29,000, well below expectations around 90,000. The unemployment rate moved from 4.1% to 4.2%, while average hourly earnings increased just 0.1% month over month. July and August payroll growth was also revised down by a combined 60,000 jobs. Bureau of Labor Statistics
Under different conditions, that combination might have triggered concerns about economic deterioration. Instead, equity futures accelerated higher. Shortly after the report, S&P 500 futures were up roughly 0.8%, while Nasdaq 100 futures were up about 1%. MarketScreener Canada
The reason is the Fed.
The labor market is weakening enough to reduce the urgency for another immediate rate hike, but the headline payroll number was still positive. That creates the type of cooling scenario equity bulls want to see: slower hiring and softer wage growth without an outright contraction in payroll employment.
The market’s rate expectations shifted accordingly. Futures pricing following the report put the probability of an October Fed hike below 20%, although expectations for a possible December increase remained substantially higher. Reuters
That distinction matters for Gareth’s game plan. The bullish argument is not simply that weak jobs are good for stocks. The argument is that softer employment data can remove pressure from yields, and lower yields can give equities more room to run.
What the 10-Year Treasury Yield Signals for the Stock Market
The clearest confirmation came from the bond market.
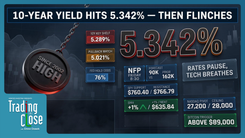
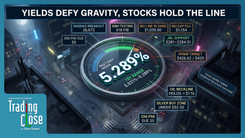
The 10-year Treasury yield pushed above 5.3% on Thursday, reaching its highest level since 2002, before reversing. Following Friday’s employment report, the yield dropped toward 5.18%. Trading Economics
The level itself matters, but the weekly candle matters more.
Gareth has repeatedly emphasized that resistance should be respected until price proves it can hold above it. The 10-year yield pushed through a major historical resistance area this week, but so far it has failed to confirm the breakout. Instead, the move is creating the possibility of a weekly topping tail.
That is the signal Gareth is watching.
A topping tail forms when a market pushes above resistance and then gets rejected before the candle closes. On a weekly chart, after testing a major long-term level, that rejection becomes more significant. It does not guarantee that yields have peaked, but it changes the near-term setup.
If the 10-year closes the week with that rejection intact, the move above resistance begins to look more like a failed breakout than the start of another sustained leg higher.
That would be constructive for equities.
The S&P 500 remains in an uptrend, and Gareth continues to work with an upside target near 8,000, where price would run into a larger ascending trend line. His framework remains straightforward: stay bullish until the chart provides a reason not to be.
As Gareth put it, “I’m going to maintain my bullish bias until the chart tells me otherwise.”
What Nike’s Price and Volume Action Showed Before Earnings
Nike provided a very different lesson.
The company reported adjusted earnings of $0.48 per share, while revenue came in around $11.2 billion. More importantly, Nike projected fiscal 2027 adjusted earnings of just \$1.15 to $1.35 per share and said revenue is expected to decline by a high-single-digit percentage. Nike Investor Relations
The stock sold off sharply in premarket trading, but Gareth’s focus was on what happened before the earnings release.
Late in Thursday’s session, Nike abruptly rolled over after grinding higher for much of the day. The decline was accompanied by a dramatic expansion in volume. Gareth highlighted a progression in 10-minute volume from roughly 45,000 shares to 70,000, 143,000, 380,000, 627,000 and eventually more than one million shares.
That does not establish why the selling occurred or who was behind it. It does show that something changed in the order flow before the earnings release.
That is the useful lesson for traders.
Price and volume can reveal changes in positioning before the fundamental explanation becomes obvious. You do not need to know who is selling to recognize that unusually aggressive selling has entered the market.
After the earnings decline, Gareth is watching a much larger technical structure. Nike is approaching historical support dating back to 2012 and 2013, with approximately \$32 and then $28 standing out as the levels that could define the longer-term setup.
The stock is damaged. The question now is whether those historical levels begin absorbing the selling.
The Oil Price Level to Watch
Crude oil delivered another important technical decision point.
Oil fell sharply Friday as markets reacted to discussions surrounding a potential coordinated release of European energy reserves. France has proposed a 50-million-barrel release as part of broader discussions over emergency supplies. Financial Times
For Gareth, the political negotiations are secondary to the chart.
The level that matters is approximately $88.80.
That area represents an ascending trend line built from multiple pivot lows. As long as crude holds it on a daily closing basis, support remains intact. A confirmed daily close below $88.80 would change the structure and open the door to a much larger downside move.
Gareth’s next major technical zone would then sit around $77 to $78.
That makes \$88.80 the decision point. Traders do not have to predict the outcome of reserve negotiations or geopolitical developments. They can wait for the chart to confirm whether support survives them.
Natural gas is in a similar confirmation phase after breaking an important trend line. Gareth is looking for spot natural gas to regain roughly 2.85 before treating the recent weakness as repaired.
Is Gold Still Bullish, and Why Is Silver More Vulnerable?
Falling Treasury yields are helping gold, but the larger chart is what keeps Gareth constructive.
Gold continues to hold a major rising trend line stretching back to May 2025. As long as that structure holds, the broader bullish setup remains intact.
The risk is time.
If gold cannot generate a meaningful bounce and instead begins moving sideways along support, the pattern could evolve into a bear flag. In other words, touching support is not enough. Gareth wants to see buyers respond to it.
Silver carries an additional complication because it trades as both a precious metal and an industrial commodity. If weaker employment is the beginning of a deeper economic slowdown, weaker industrial demand could create a headwind that gold does not face to the same degree.
Copper reinforces that concern. Its chart remains technically weak, giving Gareth a reason to stay cautious on the industrial side of the metals complex even while gold continues to hold its larger bullish structure.
What Weak Payroll Growth Could Mean for the Fed
The biggest takeaway from this morning is that the market is showing traders which transmission mechanism matters right now.
Weak payroll growth reduced expectations for an immediate Fed hike. That pushed Treasury yields lower. The 10-year is simultaneously rejecting a major long-term resistance area. Lower yields then relieve some of the valuation pressure on equities, allowing the S&P 500’s existing uptrend to remain intact.
Nike’s unusual volume revealed a change in positioning before the earnings reaction. Oil’s $88.80 level gives traders a defined point where the technical structure changes. And for Gold’s trend line, the reaction from support will tell traders whether buyers still control the larger trend.
That is the game plan: Identify the level that tells you when the market’s behavior has changed.
For the S&P 500, Gareth remains bullish with roughly 8,000 as the larger upside target. For the 10-year yield, the weekly rejection is the confirmation to watch. For crude, $88.80 is the line in the sand.
Trading involves substantial risk. All content is for educational purposes only and should not be considered financial advice or recommendations to buy or sell any asset. Read full terms of service.