Trading The Close Market Recap - 10/01/2026: 10-Year Yield 'Sleeper Hold' Spurs Tech Rally; Semiconductor Breakouts & H&S Signals

Yields Are Still in Control as Stocks Fight Back Into the Close
Stocks fought back from their intraday lows today, but the most important chart was not the S&P 500, Nasdaq, or even the semiconductor sector.
It was the 10-year Treasury yield.
The 10-year pushed as high as 5.342%, reaching levels not seen since 2002, before finally showing signs that the relentless move higher may be getting stretched. That matters because equities are trying to stabilize at the same time yields are testing an extreme. If yields begin to pull back, stocks suddenly have room to breathe. If they keep pushing higher, today's equity recovery becomes much harder to trust.
That was the key setup into the close. The market did not suddenly become easy or decisively bullish. It reached a point where several technical conditions began lining up for a potential shift, and now traders need confirmation.
Why the 10-Year Treasury Yield Is Important for Stocks Right Now
The macro backdrop gave stocks some help. PCE inflation came in cooler while recent labor data remained strong, leaving the market balancing softer inflation against an economy that has yet to meaningfully crack.
Rate expectations reflect that tension. The Fed rate tool showed 76% odds of rates remaining unchanged at the upcoming meeting, even as expectations continue to lean toward another hike later in the year.
But Drew's focus was less on predicting the Fed and more on watching how the bond market responds.
After a nearly uninterrupted run of green candles dating back to September 3, the 10-year yield finally printed a red daily candle following its push to 5.342%. More importantly, Drew identified what he calls a "sleeper hold" pattern, a three-factor technical setup that can precede a reversal or meaningful consolidation.
"This is one of the most amazing signals," Drew said, noting that the same setup recently helped identify a top in semiconductors.
The weekly close is now important. A narrow-bodied weekly candle would add another layer of confirmation to the daily signal. If yields begin retracing, 5.021% becomes an important downside level to watch.
That is the transmission mechanism for equities. Tech does not necessarily need yields to collapse. It needs the pressure from continuously rising yields to ease.
Key Support and Resistance Levels for the S&P 500 and Nasdaq
The S&P 500 reflected that possibility today.
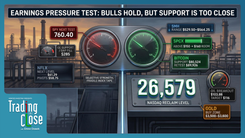
SPY pushed lower intraday before buyers stepped in aggressively, leaving behind a large lower wick and defending the \$760.40 support area. Whether traders want to call the candle a textbook hammer or simply a downside rejection matters less than what the price action showed: sellers had control, pushed into support, and could not hold the market there.
That changes the near-term setup.
The first level overhead is \$766.79. A move through that resistance would give the recovery more credibility, while a failure to build on today's rejection would keep SPY trapped in the same uncertain structure.
The Nasdaq is showing a similar battle, but with an important difference. It continues to hold above the declining trend line that previously capped price from the all-time highs. Bulls would prefer to see price accelerate away from that breakout level, but holding above former resistance is still constructive.
The all-time high area just above 27,200 is the first major test. Beyond that, the more interesting zone sits above 28,000, where two longer-term trend lines converge near a major psychological round number.
That is where the upside gets harder.
Are Semiconductors Confirming a Broader Stock Market Rebound?
If yields are the macro pressure point, semiconductors are one of the clearest places to watch whether equity buyers are actually willing to take risk again.
SMH rallied more than 1% and closed above its 61.8% Fibonacci retracement, measured from the all-time high to the July low. That level matters because it has been acting as an important decision point inside the larger recovery.
Now Drew wants confirmation.
Another daily close above the zone would strengthen the breakout and begin turning former resistance into support. If that happens, the next major upside level comes in around \$635.84.
Micron is part of the same story. MU held near the upper end of its consolidation following earnings and continues to pressure horizontal resistance around \$1,035.50. A confirmed breakout would shift attention first toward the open gap and then toward the midpoint of its broader parallel channel.
That channel becomes especially useful if MU moves into territory where obvious historical resistance becomes scarce. Instead of guessing where momentum might stall, the parallel structure gives traders a framework for projecting the next potential resistance zone.
Sandisk is showing another version of the same setup. Price remains near the neckline of a large inverse Head and Shoulders pattern, with the measured move pointing above \$2,600. Notably, that projection also lines up with an inclining parallel channel.
When independent technical tools begin identifying roughly the same destination, the level deserves more attention.
Breakout Retests Put ACN and TKO in Focus
Two of the cleaner individual-stock setups from today's show were Accenture and TKO, but for opposite reasons.
Accenture surged through \$197.98 following its earnings report, triggering an inverse Head and Shoulders breakout. The move itself is bullish, but chasing the breakout is not necessarily the best trade.
Drew's preferred setup is the retest.
If ACN pulls back toward \$197.98 and that former neckline becomes support, traders get something much more valuable than a dramatic green candle: a defined level where the trade can be tested and invalidated.
For traders looking for a shallower retracement, \$201.79 is the first Fibonacci support. If the larger pattern remains intact, its measured move points toward \$277.37.
TKO presents the mirror image. Its large Head and Shoulders pattern has already broken its neckline, with last week's close providing confirmation. The measured move projects toward \$137, but there is an important support shelf around \$166 that could interrupt the decline.
A bounce from there would not automatically invalidate the bearish pattern. In fact, a rally back toward the broken neckline could produce the cleaner setup by allowing traders to see whether former support becomes resistance.
That is the broader lesson from both charts. A breakout or breakdown tells you direction. The retest often tells you whether the market actually accepts that direction.
When Does Strong Momentum Become a Bad Entry?
Synopsys offered the clearest warning against chasing today's strongest movers.
SNPS jumped 12.78% following news of a deal with OpenAI, but the rally drove price directly into a declining trend line dating back to July 2025 while daily RSI reached 74.41.
The headline is bullish. The location is much less attractive.
An RSI above 70 does not guarantee a reversal, and a stock can remain overbought while continuing higher. But when an extended momentum reading appears at established resistance after a double-digit one-day move, the risk-reward changes quickly.
That is exactly where traders can get trapped by buying the story instead of the chart.
Wells Fargo sits near the opposite extreme. WFC pierced a long-term inclining trend line while RSI fell to 32.58, creating conditions for a possible oversold bounce toward \$83.54.
But Drew highlighted an important distinction: support is not necessarily getting stronger because it keeps holding.
"The more and more you hit these lines the weaker they become."
WFC has now tested this trend line five times. Each successful defense consumes some of the demand sitting around that level. A bounce may still develop, but another test should be treated with more caution than the first or second.
That is trader psychology expressed through price. Repeated tests are information.
Silver, Natural Gas, and Bitcoin Send Mixed Technical Signals
Outside equities, the setups remain mixed rather than uniformly risk-on.
Silver continues to resemble a true bear flag, with price moving sideways near the lows rather than producing a meaningful relief bounce. Its Head and Shoulders structure points toward the \$53 area if the bearish pattern continues.
Natural gas is approaching a different decision point. After extending its decline, price is moving toward an inclining trend line around \$2.98. That does not guarantee a bottom, but it gives traders a clearly defined area to watch for a technical reaction.
Bitcoin remains constructive while holding above former horizontal resistance. The more important test sits just above \$89,000 at the neckline of the previous Head and Shoulders structure. Clearing that area would materially improve the larger technical picture.
These markets do not all need to point in the same direction. In fact, the divergence is useful. It reinforces why this environment rewards selectivity rather than a blanket bullish or bearish call.
What Should Traders Watch After the Jobs Report?
The next session comes with another major catalyst in the Non-Farm Payrolls report, but the mistake would be focusing only on whether the jobs number beats or misses expectations.
Watch the reaction.
The 10-year yield is the first tell. If the sleeper hold confirms and yields begin backing away from 5.342%, the pressure that has weighed on long-duration equities begins to ease. That would give today's SPY rejection, Nasdaq breakout hold, and semiconductor strength a better chance to develop.
If yields instead resume their push higher, those bullish equity setups face a much tougher test.
Then watch whether today's technical levels actually hold. SPY has \$760.40 underneath and \$766.79 overhead. SMH needs to confirm above its 61.8% retracement. The Nasdaq needs to remain above its breakout trend line. ACN and TKO offer cleaner opportunities if their broken necklines are retested rather than chased.
The point is not to predict tomorrow's payroll number. It is to know what market reaction would confirm or invalidate the setups already on the board.
The Bottom Line for Stocks and Treasury Yields
Today's recovery was meaningful, but it was not a standalone signal.
The more important development was that equities rejected their lows just as the 10-year yield began showing its first meaningful signs of technical exhaustion after an extended run higher. Semiconductors strengthened, the Nasdaq held its breakout structure, and several individual stocks produced clearly defined setups.
Now the market has to prove it.
For Drew, that means waiting for confirmation instead of chasing the first move. A pullback in yields would give equity bulls breathing room. Continued strength in yields would keep pressure on the same areas trying to break out.
The levels are already mapped. The next job is simply to see which side confirms.
Trading involves substantial risk. All content is for educational purposes only and should not be considered financial advice or recommendations to buy or sell any asset. Read full terms of service.