My Trading Game Plan Revealed - 12/26/2025: S&P Double Tap Risk, Nasdaq Lag, Silver Bubble and January Volatility

Welcome back from the holiday. As the markets settle into the final, characteristically quiet trading week of the year, a unique environment is taking shape. With institutional players largely on vacation until January, the stage is set for low-volume drifts and potential retail-driven manias. In this morning's My Trading Game Plan, Gareth Soloway, Chief Market Strategist at Verified Investing, broke down the critical technical patterns suggesting a calm float higher into year-end, followed by a potential storm in January.
Today’s article dives deep into these setups, exploring the historical precedent for the S&P 500’s current trajectory, the explosive and euphoric rally in silver, and a masterclass in technical analysis on the market’s biggest names.
The S&P 500’s Date with a “Double Tap”
While the current market bias is neutral to positive, the upside potential is becoming increasingly limited. The S&P 500 is methodically floating toward a massive, multi-year trendline that has defined every major high and low for the past five years. The index is approaching the 7,000 level, a move of just over 1% from current prices. This slow, steady grind is typical of holiday trading, but what happens when it reaches that line is the critical question for January.
Gareth highlighted a powerful historical precedent for this setup: the "double tap."
"What's a double tap? Well it's the same thing that happened back in let's go back to the bigger time frame here back in the bull market of 2021. Here you have your move up into the trend line reversal move back up double tap and down we go."
This pattern involves an initial test of a major resistance line, a pullback, and then a second test (the double tap) that ultimately fails and leads to a significant correction. The current price action is mirroring this 2021 setup with remarkable precision. The market tagged this same trendline earlier, experienced a pullback, and is now returning for a second test. Based on this probabilistic model, the stage is being set for a market sell-off in January once the institutional volume returns.
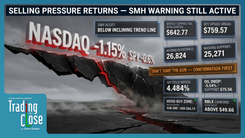
Under the Hood: Why the Nasdaq Is Lagging
A key divergence in the market right now is the underperformance of the Nasdaq 100 compared to the S&P 500. While the S&P is flirting with its all-time highs, the tech-heavy Nasdaq is not. The explanation is simple and lies within the market’s largest components: the Magnificent Seven.
A quick look at these mega-cap tech stocks reveals that none are truly leading the charge to new highs, which explains the drag on the index they dominate.
- Amazon (AMZN): Trading at $231 USD, approximately 10% below its all-time high of $258 USD.
- Microsoft (MSFT): After hitting a high of $553 USD, it has pulled back to $487 USD.
- Nvidia (NVDA): Currently at $190 USD, a significant distance from its peak of $212 USD.
- Meta (META): Demonstrating one of the largest pullbacks from its highs.
- Google (GOOGL): The closest of the group, trading at $315 USD compared to its high around $330 USD.
Since these stocks constitute roughly 50% of the Nasdaq 100’s weighting, their individual weakness prevents the index from achieving new records. This internal weakness is a crucial piece of the market puzzle, suggesting that the broad market rally lacks the full-throated leadership from the technology sector that has powered it for so long.
A Masterclass in Technical Analysis
One of the most valuable segments of this morning’s show was Gareth’s live demonstration of how he analyzes a chart from scratch. By removing all indicators and focusing purely on price action and trendlines, he revealed powerful, actionable levels on several Magnificent Seven stocks. This process underscores a core tenet of his methodology: simplicity beats complexity.
"You don't have to over complicate it with a thousand different indicators on your chart, in fact when I do that I get paralysis by analysis… just use simple trend lines."
Let’s review his analysis:
Amazon (AMZN)
The first pattern that emerges on Amazon’s chart is a potential Head and Shoulders top. This classic bearish reversal pattern would be confirmed by a break below the neckline, located around the $218-$219 USD level. A measured move from such a break would target the pivot low from April. On the flip side, should Amazon rally, key resistance formed by a parallel channel sits in the $260-$270 USD range. This simple analysis provides two clear, long-term zones for action: a potential buy zone at support around $180-$187 USD and a shorting opportunity at resistance.
Microsoft (MSFT)
Microsoft’s chart presents what Gareth described as a "weird double top," resembling an 'M' formation—a bearish pattern. A significant concern is a large, unfilled gap far below the current price. In technical analysis, gaps often act as price magnets.
"I don't like big gaps in the chart like this… we say gaps are meant to be filled."
In the near term, Microsoft found support at the high from 2024, but the subsequent bounce appears to be forming a bear flag. A break below this support would likely trigger a move to fill that lower gap, potentially sending the stock down to the $400 USD level. Conversely, a rally would face stiff resistance at the all-time high of $553 USD. A confirmed break above that level would put the stock in uncharted territory, invalidating the bearish thesis.
Meta (META)
Meta’s chart offers a stunning example of the power of a single trendline. A line drawn from the bear market low in 2022 connects perfectly with subsequent major lows, including the most recent one. The bounce from this trendline was immediate and powerful.
"When people say they don't believe in technical analysis showing them something this simple is really a game-changer… just buying right there because it's a trend line support boom look at that gain on on meta."
This trendline, currently around $600 USD, is now the critical line in the sand. A break below it would signal a major trend change, likely targeting levels below $500 USD. To the upside, a large gap provides a clear resistance target at $753 USD, which also aligns with a potential double top.
Silver’s Euphoric Spike: A Generational Bubble?
While the equity markets drift, the real fireworks are in the precious metals sector, specifically silver. Gareth described the move as an "absolute short-term bubble" showing clear signs of euphoria. The technicals are staggering. The Relative Strength Index (RSI), a momentum indicator, is over 90. To put that in perspective, the last time the RSI reached this level was in 1979. Even during the 2011 peak, it only reached 85.
This parabolic move is being driven by a perfect storm of factors:
- Retail Mania: The current craze in silver is reminiscent of the meme stock phenomenon. "The meme craze is in silver and so you're getting an ala GameStop type move in silver right now."
- A Lack of Sellers: With institutional traders away, retail has outsized control. Furthermore, investors with large gains from earlier in the year are likely waiting until January 2nd to sell, pushing their tax liability into the next year.
- Momentum Chasing: As Gareth explained, "it's like a rubber band: the more you stretch it the tighter it gets and when it snaps back, it snaps back more." This extreme extension makes a sharp correction inevitable.
The performance is breathtaking. Since its April low, silver is up over 160%. For comparison, the red-hot AI stock Nvidia is up 117% over the same period. While the momentum could carry it slightly higher, a significant correction is coming. Gareth noted that a pullback to the $50 USD per ounce level—the breakout point from the 2011 all-time high—is a realistic target.
The Coming Rotation and the 2026 Outlook
The extreme move in silver sets up a potential rotation trade. Gareth theorized that much of the speculative retail money that typically flows into crypto has temporarily migrated to silver. When silver’s bubble inevitably pops, that capital will look for a new home. Bitcoin and altcoins could be the primary beneficiaries. Bitcoin is already showing strength, and Gareth maintains a bullish stance with a target of $97,000 to $100,000 USD, as long as its key trendline support holds.
Looking further ahead to 2026, a major concern is the US Dollar. The DXY has been in a technical uptrend since the 2008 financial crisis low. However, Gareth fears a breakdown of this trend in the coming year, driven by a perceived loss of the Federal Reserve's independence. This could force foreign buyers of U.S. debt to demand higher interest rates, pushing up long-term yields (like the 10-year) even as the Fed cuts short-term rates. This dynamic is already confusing many, and it could become a dominant market theme in 2026.
Conclusion: Prepare for the Return of Volume
The final week of the year is shaping up exactly as anticipated: low-volume, holiday trading with a neutral-to-positive drift. However, beneath this calm surface, major technical patterns are reaching their conclusions. The S&P 500 is approaching a critical resistance level that has historically preceded major downturns. The speculative fervor in silver has reached a fever pitch, signaling an imminent and likely sharp correction.
For now, traders can watch these patterns develop. But the real test will come in January. When the institutions return and volume floods back into the market, these well-defined technical levels will be tested. Be prepared for a significant increase in volatility and the potential for a sharp pullback in both equities and precious metals early in the new year.
Trading involves substantial risk. All content is for educational purposes only and should not be considered financial advice or recommendations to buy or sell any asset. Read full terms of service.