Trading The Close Market Recap - 03/30/2026: Oil Surge Sparks Market Selloff — S&P Oversold, AI/Chips Breakdowns & Bitcoin Warning

The markets faced a relentless wave of selling pressure today, painting screens red across the board as macroeconomic headwinds and geopolitical uncertainties took center stage. With no clear resolution to the ongoing tensions in the Middle East, energy markets are surging, sending ripples of anxiety through equities. In this afternoon's Trading The Close, Pro Trader Drew Dosek at Verified Investing broke down the critical technical damage inflicted on the major indices, highlighted the defensive rotations taking place, and mapped out the exact levels savvy investors need to watch.
While retail traders often panic during broad market selloffs, professional traders view these moments as periods of profound opportunity. Today's article expands on the technical concepts, intermarket relationships, and psychological frameworks discussed in the show, providing a comprehensive guide to navigating this volatile environment.
The Macro Catalyst: Oil's Grip on Market Sentiment
To understand the current equity selloff, one must look directly at the energy sector. Geopolitical instability has historically acted as a primary catalyst for crude oil spikes, and the current landscape is no exception.
As Drew noted during the broadcast: "There really is no resolution into the Middle East and a lot of investors are seeing oil marching up on the charts and exiting stocks…"
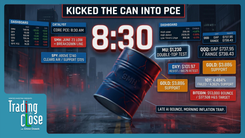
US Oil has become the ultimate dictator of market sentiment. On the charts, oil faced a massive resistance wall at $103.15. After testing and failing at this level multiple times overnight and into the morning, price action finally broke through in the afternoon, triggering widespread equity liquidations. The next major resistance target for US Oil sits at $110.33.
Historically, rapidly rising oil prices act as a regressive tax on the consumer and a margin-crusher for corporations. When energy input costs soar, corporate forward guidance typically contracts, prompting institutional investors to de-risk their portfolios. However, markets are fluid. If oil were to collapse back under the $103.15 level, it would provide a massive sigh of relief for equities, potentially sending oil back down to retest support at $98.11. Monitoring this specific commodity is no longer optional for equity traders; it is a prerequisite for understanding the broader market's next directional move.
Broad Market Capitulation and Oversold Extremes
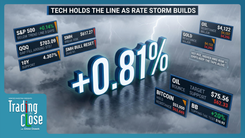
The damage to the major indices has been severe, but it is also creating extreme technical conditions that demand attention. The S&P 500 closed down 0.33%, which might seem mild on the surface, but the underlying technical structure reveals a market struggling for air.
The index has sliced through major historical support zones, including the 200 daily moving average and the 50 weekly moving average, without so much as a reflex bounce. This relentless downward drift has pushed the Relative Strength Index (RSI) down to a staggering 27.3. In technical analysis, any RSI reading under 30 indicates near-term oversold conditions.
When markets become this stretched to the downside, they act like a coiled spring. While picking a bottom is a dangerous game, the probabilities of a violent short-squeeze rally increase with every passing day of uncorrected selling. Should positive news break regarding the Middle East, the S&P 500 is primed for a massive rip, facing initial resistance at 644.29 (on the SPY ETF), followed by 665.01. Until then, the next logical support zone lies in the 50% area of the current parallel channel, just above the pivot highs established prior to last year's liberation date announcements.
The NASDAQ fared even worse, dropping 0.78% as technology stocks bore the brunt of the selling. The index is printing lower lows, which mathematically increases the probability of continued near-term downside. However, like the S&P 500, the NASDAQ is deeply oversold. Traders should be monitoring the 22,499 points level for a potential bounce, which could target the bottom of the parallel channel at 23,822 points.
The AI and Semiconductor Reality Check
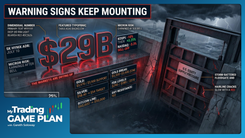
Perhaps the most significant structural shift occurring in the market is the aggressive unwinding of the artificial intelligence and semiconductor trade. The semiconductor sector plunged 3.13% today, confirming a breakdown that has been brewing for weeks.
"The AI tech build out play is losing a little bit of steam considering how much money it is costing, and then the concern for being in debt and when are they going to recover some of those investments," Drew explained.
This fundamental reality check is now perfectly mirrored in the technicals. The initial euphoria surrounding AI data center build-outs is colliding with the harsh reality of capital expenditures (CAPEX) and high interest rates. When companies take on massive debt to fund infrastructure, investors eventually demand a clear timeline for return on investment (ROI). As those timelines stretch, the premium multiples assigned to these stocks begin to compress.
The technical damage across the memory and AI sector is profound:
- WDC: Closed beneath a massive inclining parallel channel that had contained price since last November. The stock now faces resistance at $267.83, with support levels cascading down to $247.30, $238, and a conservative trend line target sub-$225, specifically around $223.
- LITE: Also closed beneath its inclining parallel channel, eyeing next support at $624.86.
- SNDK: Broke down from a parallel channel established back on January 2nd, with downside targets at $510 and $470.
For swing traders, these breakdowns offer clear roadmaps. Rather than catching falling knives, the professional approach is to wait for price to reach these deep, multi-factor support levels to play the inevitable reflex bounces.
Defensive Rotations and Overbought Warnings
While growth and tech suffered, capital didn't just evaporate—it rotated. In times of market stress, institutional money flows into defensive, recession-resistant sectors. We saw this play out perfectly today with consumer staples and energy names pushing into the green.
Procter & Gamble (PG) rallied 1.41%, lifting its RSI from deeply oversold levels near 30 up to 37.10. However, traders must remain objective; the stock is still trapped in bearish consolidation. It requires a daily close above $147.38 to confirm a breakout toward $151.65. Without that confirmation, the path of least resistance remains down toward $138.52.
Pepsi (PEP) saw an impressive 2.47% pop, but it is currently staring down a massive declining trend line resistance at $159.18. Similarly, Occidental Petroleum (OXY) pushed up 1.4%, but its RSI has skyrocketed to an overbought 82.53.
This presents a classic psychological trap for retail investors. Seeing a sea of red, amateur traders often chase the few green tickers on their screen, buying right into major resistance and overbought conditions. The professional approach, as outlined by Pro Trader Drew, is to wait for pullbacks. For OXY, that means ignoring the FOMO and waiting for a pierce of $60, targeting the consolidation zone around $59, or waiting for the ultra-conservative entry at $50.92 to re-attack the $62 level, rather than buying the breakout at $64.70 or the trend line at $64.58.
The Contrarian Psychology of Headline News
One of the most valuable lessons from today's recap involved Meta, which closed up 2.03% despite a weekend filled with overwhelmingly negative headlines regarding impending lawsuits.
"Whenever something hits the news, it's basically reached its point of being a pinnacle in either direction… when it hits the news, that's generally your signal for either a buying opportunity if that stock's plummeting down, or if it's ripping off the charts, that's your opportunity to sell," Drew emphasized.
This phenomenon is rooted in market liquidity and institutional behavior. By the time a negative story reaches mainstream weekend news, the institutions that actually move markets have already priced it in. They use the subsequent retail panic-selling on Monday morning as liquidity to accumulate massive positions at a discount.
Meta's chart reflects this perfectly. Ignoring the noise and focusing on the levels, Meta has clear upside targets if it can clear the declining trend line resistance at $5.52. Above that, the path opens up to $582, followed by the inclining channel resistance at $605. Trading the chart rather than the headline is the ultimate edge in modern markets.
Intermarket Divergences: Yields, Small Caps, and Metals
A fascinating divergence emerged today between the bond market and small-cap equities. The 10-year Treasury yield actually saw some relief, pulling back within its consolidation range of 4.3% to 4.46%. Traditionally, falling yields act as a tailwind for the Russell 2000 (IWM), as small-cap companies are highly sensitive to borrowing costs.
Yet, the IWM ignored the falling yields and closed lower, breaking beneath its head and shoulders measured move target. This divergence is a massive red flag. When an asset fails to rally on what should be bullish macroeconomic data, it indicates severe underlying weakness. The IWM is now targeting $238.04, with a deeper level at $228.90.
Meanwhile, the precious metals complex is taking a breather. Both Gold and Silver are printing bearish consolidation patterns, forming short-term bear flags. Gold has a massive wick from March 23rd providing structural support, with a hard line in the sand at $4,185. Silver faces a similar setup, needing to break through trend line resistance at $64 and a pivot at $61.10 before finding its next major support. This sideways chop is actually healthy, allowing the metals to digest their recent massive moves before deciding on their next directional leg.
The Crypto Winter Warning
The cryptocurrency market, often a leading indicator for risk-on appetite, is flashing severe warning signs. Bitcoin's weekly timeframe has painted a textbook head and shoulders pattern—one of the most reliable reversal formations in technical analysis.
Currently, the narrative remains firmly bearish unless Bitcoin can secure a daily close above $73,173.96. Without that invalidation, the measured move of this head and shoulders pattern points to a devastating target of sub-$40,000.
However, professional traders don't fear market crashes; they budget for them. Drew's strategy perfectly encapsulates this mindset: waiting patiently with cash on the sidelines, ready to start aggressively accumulating Bitcoin once it crosses into sub-$50,000 territory. This level of patience—willing to wait weeks or months for the exact right price—is what separates consistent profitability from gambling.
Viewer Requests and Technical Precision
The Verified Investing community is built on education and interaction, highlighted today by a viewer request to analyze RKLB. This chart serves as a masterclass in support-turned-resistance.
RKLB recently broke down from bearish consolidation, slicing straight through its first major support level at $6,126. In technical analysis, broken support immediately becomes overhead resistance. Therefore, any bounce will face a brick wall at $61.26. However, because the stock spent two months consolidating and is not yet deeply oversold on the daily timeframe, a high-probability entry sits lower, at the bottom of the parallel channel at $50.84. By identifying these multi-factor levels in advance, traders can set their alerts and step away from the screens, removing emotion from the execution process.
Conclusion: Discipline in the Face of Volatility
Today's market action was undoubtedly harsh, but it is exactly this type of volatility that creates generational trading opportunities. Whether it's the S&P 500 reaching extreme oversold levels, the semiconductor sector returning to historical valuations, or Bitcoin setting up for a massive accumulation zone, the charts are providing a clear roadmap for those willing to read them objectively.
The key takeaway from today's Trading The Close is the absolute necessity of discipline. Do not chase overbought defensive stocks. Do not panic-sell into oversold index conditions. And most importantly, do not trade the news. By relying on strict technical levels, understanding the macroeconomic impact of commodities like oil, and maintaining a probability-based mindset, traders can navigate this sea of red with confidence.
For investors looking to deepen their understanding of these concepts, Verified Investing has just launched a brand new YouTube channel, Verified Investing Extra (VIE). This new platform will be more about news, entertainment, and culture. This will allow the main VI channel to remain dedicated entirely to technical analysis education, market psychology, and chart mastery, providing the tools necessary to trade like a professional. In markets like these, education is more than an advantage—it's survival.
Trading involves substantial risk. All content is for educational purposes only and should not be considered financial advice or recommendations to buy or sell any asset. Read full terms of service.