Trading The Close Market Recap - 12/01/2025: Semiconductors Lead Amid Year‑End Profit‑Taking, Yen Carry‑Trade Risk & Bitcoin Test

Welcome back from the holiday weekend. As traders and investors returned to their desks, the market presented a complex picture of profit-taking, sectoral divergence, and looming macroeconomic catalysts. In this afternoon's Trading The Close, Pro Trader Drew Dosek of Verified Investing dissected the day's action, revealing the conflicting forces at play as we close out the year and prepare for a pivotal Federal Reserve meeting next week.
Today’s analysis goes beyond the surface-level numbers, exploring the significance of light-volume selling, the critical leadership role of the semiconductor sector, and a major international risk factor that could have profound implications for U.S. equities.
A Market of Conflicting Forces
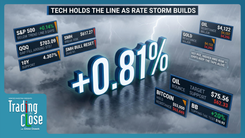
The first trading day of a new month, particularly December, often brings a wave of fresh capital into the market from retirement fund allocations. However, today’s session defied that seasonal tendency. Despite this expected inflow, major indices finished in the red, with the Dow Jones falling 0.81%, the S&P 500 down 0.4%, and the Nasdaq declining 0.38%. This selling pressure suggests that a more powerful force is currently at work: year-end profit-taking.
As Drew noted on the show, institutional investors are likely beginning to lock in gains and finalize their books on what has been a tremendous year for many stocks. The fact that this selling occurred on very light volume is particularly noteworthy.
"Look at today's volume, just slightly above Friday's, and Friday's wasn't even a full day of trading… whenever volume is light, the likelihood markets float actually increases, but yet we saw a down day on the markets with light volume that usually could have investors buying that dip right back up, and it just didn't happen today."
This is a subtle but crucial observation. Typically, low volume allows bullish momentum to easily push prices higher. When the market instead drifts lower on light participation, it signals a lack of aggressive buyers and an underlying eagerness to sell, even in the absence of significant market-moving news. For the S&P 500, this resulted in a second consecutive tag of the upper parallel channel trendline, followed by a slight pullback. The key level for bulls to defend is now the inclining trendline at 677.26. A break below that level would bring the next major support at 652.84 into focus.
The Semiconductor Canary in the Coal Mine
While the broader market showed weakness, one sector stood out as a beacon of strength: semiconductors. The VanEck Semiconductor ETF (SMH) bucked the trend, finishing the day in positive territory. This divergence is more than just a daily anomaly; it’s a critical piece of the market puzzle. As Drew explained, the semiconductor sector often acts as a leading indicator for the entire market.
"When the semis lead, you know what? You better follow suit because they bring the rest of the markets with them. When the semis fail, you better get out of the markets."
The strength in semis, fueled by continued bullishness in names like Nvidia and the broader AI and data center narrative, suggests that investor appetite for the market’s primary growth theme remains intact. This creates a fascinating tug-of-war: are the semis providing a true signal of underlying market health that will eventually pull the other indices higher, or is this a final gasp of strength in a narrowing market leadership?
Technically, the SMH has pushed directly into a resistance zone. A decisive breakout above this area could propel it toward the top of its parallel channel near $370.38. Conversely, a rejection from this level could signal that the profit-taking seen elsewhere is about to catch up with the market’s leaders. Traders should watch this sector with extreme prejudice, as its direction in the coming days could foreshadow the market’s path into the new year.
Macro Storm Clouds Gathering
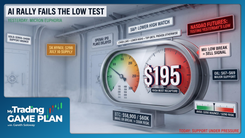
This week serves as the prelude to next week's highly anticipated FOMC meeting, where the market is pricing in an over 80% chance of a rate cut. Before we get there, several key data points will shape the Federal Reserve's thinking. On Wednesday, the ISM Services report will provide a crucial look into the health of the U.S. economy's largest sector. As Drew highlighted, this isn't just another data point.
"Why this service sector release is very important is because it covers 80 to 85% of private sector employment here in the United States. So the Fed will use that gauge to obviously influence the rate cuts potentially coming next week."
A surprisingly strong number could dampen expectations for a rate cut, while a weak reading could reinforce the Fed's dovish stance. This will be followed on Friday by the PCE inflation report and the Michigan Consumer Sentiment survey.
However, a potentially more significant risk is brewing overseas. The Japanese 10-year yield has climbed back to levels not seen since 2008. This is critically important due to the "yen carry trade," a global financial strategy where investors borrow money at Japan's historically low interest rates to invest in higher-yielding assets, such as U.S. stocks. If Japanese yields continue to rise, it makes this trade less profitable and riskier, potentially forcing a massive unwind. This would involve investors selling their U.S. stock positions to pay back their yen-denominated loans, creating a wave of selling pressure that is completely disconnected from U.S. corporate fundamentals. This is a systemic risk that savvy investors are now monitoring closely.
Bitcoin's Battle at a Critical Level
The risk-off sentiment was most apparent in the cryptocurrency market, which saw significant selling pressure. Bitcoin plunged below the key psychological and technical level of $85,000 USD before finding its footing. The daily chart now shows a long bottoming tail candle, indicating that buyers did step in to defend the support level at $85,626 USD.
While the chart is not technically broken, the ferocity of the sell-off is a near-term warning sign. The key question now is whether this was a healthy flush of weak hands or the beginning of a more significant correction. The immediate resistance to watch is the 50% line of the parallel channel at $92,271 USD. If Bitcoin can reclaim that level, the bullish trend remains intact. However, a failure to bounce and a subsequent break of the $85,626 USD support would open the door to a retest of the $80,000 USD mark.
The pain was even more acute in the altcoin space, with Ethereum also testing a make-or-break level. On the weekly timeframe, ETH is holding support at the bottom of a long-term trend channel, around the $2,600 USD level. A break below this critical support could trigger a much deeper correction toward the $2,200 USD area. For crypto bulls, defending these levels in Bitcoin and Ethereum this week is paramount.
A Masterclass in Trendlines
Beyond the daily market fluctuations, today's show provided a powerful lesson in the enduring relevance of technical analysis, specifically the use of trendlines. Two stocks, Synopsys (SNPS) and Kava (KAVA), served as perfect case studies.
Synopsys received a major boost after Nvidia announced a $2 billion USD investment in the company. The news sent the stock surging directly into a key resistance level. This wasn't a random price point; it was a "hidden trend line" drawn from previous pivots on the chart. Drew demonstrated how this single line had acted as both support and resistance multiple times in the past, and it is now capping the current rally. The next major test for SNPS will be this trendline resistance at $463.85 USD.
Kava, one of the day's biggest winners in the S&P 500, offered an even more compelling example. Drew showed how a long-term trendline, once broken, was successfully retested as support, providing the launchpad for the current move. This illustrates one of the core tenets of technical analysis.
"What happens when trend lines break? Well, they like to go back and retest the trend line that they broke."
This principle now sets up a potential future price target for Kava. By drawing a new trendline from recent pivot lows, Drew identified a potential long-term target near $80 USD, where the price would once again interact with a major historical trendline. This type of multi-step analysis provides a roadmap for traders, allowing them to anticipate future price action based on recurring, predictable patterns.
Conclusion: Navigating the Year-End Crosscurrents
The market has entered a complex and potentially volatile period. The crosscurrents of institutional profit-taking, the persistent strength in leadership sectors like semiconductors, and a backdrop of pivotal economic data create an environment ripe with both opportunity and risk. While the S&P 500 and Nasdaq are showing signs of fatigue, the underlying bullish narrative in AI has yet to break.
The key takeaway is that a disciplined, technical approach is essential for navigating these conditions. The charts are providing clear levels of support and resistance across all asset classes—from the S&P 500's trendline at 677.26 to Bitcoin's floor at $85,626 USD and Ethereum's critical weekly support at $2,600 USD. By focusing on these data-driven levels and understanding the larger macro forces at play, traders can position themselves to react logically rather than emotionally as we head into the final, decisive weeks of the year.
Trading involves substantial risk. All content is for educational purposes only and should not be considered financial advice or recommendations to buy or sell any asset. Read full terms of service.