Gold at Pivotal Technical Inflection: Converging Support Holds Amidst Bullish Long-Term Fundamentals
Written by Gareth Soloway, Chief Market Strategist at VerifiedInvesting.com - May 17th, 2025
Article Summary: Gold sits at a critical technical inflection point where ascending trendline meets horizontal support at $3,150-$3,120. With Moody's US debt downgrade and deteriorating fiscal conditions, could this convergence zone launch the next major leg higher in precious metals?
-----------------------------------------------------------------------------------------------
In the constantly evolving landscape of precious metals trading, few moments capture the attention of technical analysts quite like what we're witnessing with gold right now. As we navigate through the mid-May price action, gold finds itself testing a textbook technical inflection point that deserves our full attention. Let's unpack the chart to understand not only where we stand, but where we're likely headed in the weeks and months ahead.
The Convergence Zone: When Multiple Supports Align
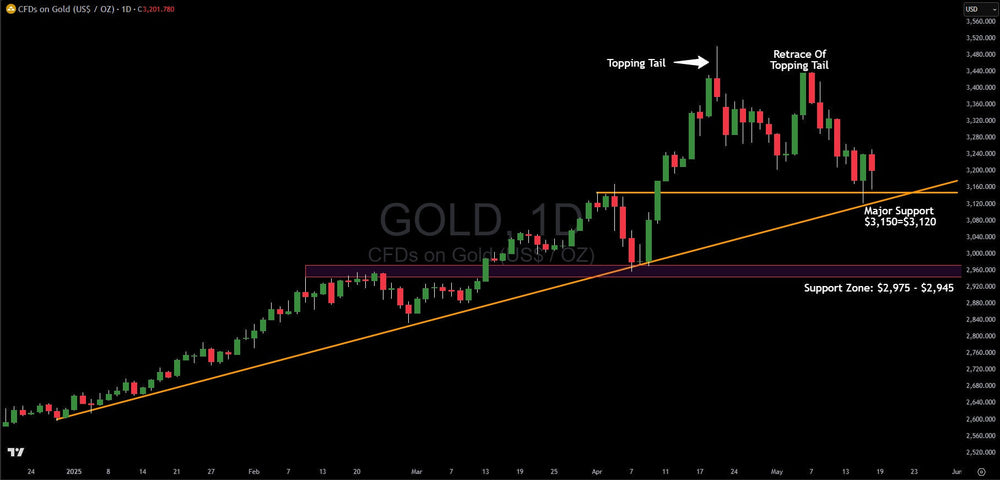
What immediately jumps out on our daily chart is the current price action hovering right at the $3,150-$3,120 support zone. But this isn't just any ordinary support level. What makes this zone so technically significant is the rare convergence of two critical support structures:
- The horizontal support band that had previously acted as resistance before becoming support
- The powerful ascending trendline that has defined gold's upward trajectory since January 2025
When we see these two independent technical elements converge at the same price point, it's like watching multiple planetary bodies align – a rare event that often precedes significant price action. This convergence has created what I call a "magnetic floor" where buying pressure typically intensifies. And indeed, that's precisely what we're seeing as price has tagged both of these supports simultaneously and held firm.
The Recent Topping Formation: A Necessary Correction
Stepping back to gain context, we need to acknowledge the recent price action that brought us to this inflection point. In mid-April, gold formed what I've marked as a "Topping Tail" – a bearish reversal candlestick pattern suggesting exhaustion among buyers after a strong rally. This signaled that the market needed time to digest its gains.
Rather than immediately collapsing, however, the market attempted to regain its footing in early May with what I've labeled as the "Retrace Of Topping Tail." This failed second attempt to breach the previous highs created what essentially amounts to a double top formation, adding additional bearish pressure that has driven prices down to our current support convergence.
This pullback, while concerning to newer investors, is actually a healthy development in the broader uptrend. Markets rarely move in straight lines, and these periods of consolidation and retracement are necessary for building a sustainable advance. Think of it as the market taking a deep breath before continuing its journey.
Lower Support Zones: The Safety Nets Below
Should our convergence support at $3,150-$3,120 fail to hold, we have a well-defined safety net below in the form of the $2,975-$2,945 support zone. This level represents a previous consolidation area that should provide substantial buying interest if tested.
However, given the technical significance of our current convergence zone and the behavior of price action as it's testing these levels, my base case scenario remains that the current support will hold. The multiple touches without decisive breakdown suggest accumulation rather than distribution at these levels.
Reading Between the Candles: What Price Action Is Telling Us
The recent price action itself provides valuable clues about market sentiment. Notice how we've seen several tests of the support zone with progressively smaller bodied candles and diminishing downside momentum. This often indicates seller exhaustion and typically precedes a reversal.
The way price is interacting with our convergence zone reminds me of a coiled spring – the more it's compressed against this technical floor, the more potential energy builds for an eventual upward move. This compression against converging support often creates the most explosive moves when the market finally decides on direction.
Beyond The Charts: The Fundamental Backdrop Strengthening Gold's Case
While my analysis always begins with technical structure, we can't ignore the powerful fundamental tailwinds supporting gold's longer-term bullish case. The U.S. fiscal situation continues to deteriorate with little political will for meaningful spending cuts. Moody's recent downgrade of U.S. debt underscores the growing concerns about America's fiscal trajectory.
As recession fears loom on the horizon, history suggests the government will likely attempt to spend its way out of economic contraction, further exacerbating the debt situation. Under these conditions, gold remains an obvious choice for investors seeking to hedge against fiat currency risk.
The precious metal has served this role for thousands of years, but it becomes particularly attractive during periods of fiscal uncertainty and potential currency debasement. The technical pattern we're witnessing now is playing out against this increasingly supportive fundamental backdrop.
Trading Implications: Probability-Based Approach
For traders looking to capitalize on this setup, I see several potential approaches based on probability rather than emotion:
- Conservative Entry: Wait for confirmation of support holding with a decisive bounce and at least one daily close above the $3,200 level before establishing long positions.
- Moderate Risk Entry: Small position entry at current levels with tight stops just below the convergence zone ($3,100) to limit downside exposure while capturing the potential bounce.
- Strategic Scale-In: Begin building a position at current levels, with plans to add on either confirmed strength or a deeper pullback to the $2,975-$2,945 zone.
Remember, successful trading isn't about certainty – it's about managing probability and risk. The current setup offers an attractive risk-reward profile for those who size positions appropriately and maintain discipline with their stop levels.
2025 Outlook: The Bigger Picture Remains Bullish
While short-term volatility may persist, my 2025 forecast maintains a decidedly bullish bias for gold as global central banks continue expanding their balance sheets and geopolitical uncertainties create demand for safe-haven assets.
The combination of deteriorating U.S. fiscal conditions, Moody's debt downgrade, and the likelihood of expanded government spending to combat recession creates a perfect storm for gold to continue its upward trajectory once this current consolidation resolves.
Conclusion: Decisive Moment at Hand
We find ourselves at a fascinating juncture for gold, where technical confluence meets supportive fundamentals. The convergence of horizontal and trendline support at the $3,150-$3,120 zone represents a critical battleground between bulls and bears.
The price behavior as it tests this convergence zone will likely determine the next significant move for the yellow metal. Based on the diminishing downside momentum and the strength of the converging support levels, I'm leaning toward an eventual resolution to the upside, though patience will be required as this pattern completes its development.
For investors with a longer time horizon, these technical inflection points often present opportune moments to establish or add to positions. As always, proper position sizing and risk management remain the cornerstones of successful trading, regardless of how compelling the setup appears.
What are you seeing in the gold markets? Are you positioned for the next move, or waiting for further confirmation? Remember, in trading, being early feels the same as being wrong – until you're suddenly right. The key is surviving long enough to be proven correct.
Disclosure: Positions may be held in the assets mentioned in this analysis. This article is for educational purposes only and should not be considered investment advice.


