WTI Crude Oil: A Technical Breakdown With Significant Downside Ahead
The crude oil market is sending signals that should have every energy investor on high alert. After examining the daily chart of WTI Crude Oil stretching back to 2021, I'm seeing a technical setup that warrants serious attention. Let me walk you through what the price action is telling us, why the recent breakdown matters, and where oil might be headed in the coming months.
The Broken Support: From Friend to Foe
If there's one thing I've learned in my 26 years of trading, it's that multi-year support lines don't break easily. But when they do? That's when you need to sit up and pay attention.
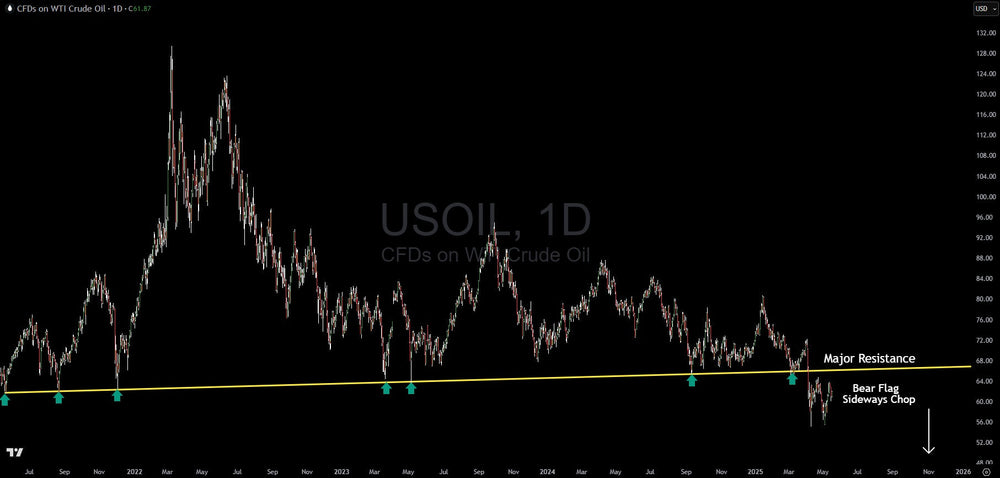
Look at that yellow line stretching back to mid-2021. This isn't just any trendline - it's a major structural support that has held firm through multiple tests (marked by those green arrows). Each time crude oil prices touched this level over the past several years, buyers stepped in reliably. The market respected this floor with almost clockwork precision.
But markets evolve, and what once was support can quickly become resistance. That's exactly what we're witnessing now. After a decisive break below this multi-year support line, crude has attempted to rally back, only to be rejected exactly where you'd expect - at the underside of that same trendline, now functioning as resistance.
This transformation from support to resistance isn't just a technicality - it's a clear signal of a significant shift in market psychology. The buyers who once eagerly stepped in at this level are now sellers, a classic example of how market sentiment can flip dramatically once key technical levels are breached.
The Bear Flag & Sideways Chop: The Calm Before the Storm
After the breakdown below long-term support, crude oil hasn't immediately collapsed. Instead, we're seeing what technicians like myself identify as a bear flag pattern combined with sideways choppy price action. This consolidation phase is typical after a major technical breakdown, and it's often mistaken by inexperienced traders as a bottoming process.
Think of this sideways action as the market catching its breath before the next leg down. It's like a boxer who's taken a hard hit - there's that moment of wobbling before potentially hitting the canvas. The bear flag pattern is particularly telling here because it suggests that this consolidation is likely a pause in a continuing downtrend rather than a reversal formation.
The choppy nature of recent price action also indicates a battle between buyers trying to find a floor and sellers looking to push prices lower. So far, neither side has gained decisive control - but the broader technical context suggests sellers have the upper hand.
Target in Sight: The Road to $43.50
Based on the technical deterioration we're seeing, my analysis points to a downside target of $43.50 for WTI crude oil in 2025. This isn't just a number pulled from thin air - it represents a projected move based on the magnitude of the breakdown and technical measuring techniques I've refined over decades of market analysis.
Could we get there sooner? Absolutely. The speed of the decline will largely depend on how quickly the fundamental picture deteriorates, but the technical roadmap is already drawn.
At around $61.87 currently, that represents a further decline of nearly 30% from current levels. For energy sector investors, this projection should prompt a serious reevaluation of exposure and timeframes.
The Macro Picture: Recession Clouds Gathering
While my analysis primarily focuses on technical signals, it's impossible to ignore the fundamental backdrop that's developing. The technical breakdown we're seeing in crude oil aligns perfectly with the macro view that the United States is likely sliding into recession later this year.
Historically, oil demand contracts significantly during economic downturns. What makes this scenario particularly concerning for crude prices is that this potential recession isn't occurring in isolation - it's happening against a backdrop of ongoing trade tensions that continue to weaken global economies.
During previous recessions, we've seen oil demand drop by 1-2 million barrels per day or more. With the current global consumption around 102 million barrels daily, even a modest percentage decline translates to a significant surplus if production doesn't adjust quickly enough.
The Trade War Effect
Trade wars create a double-whammy effect for oil prices. First, they directly impact global manufacturing, shipping, and commerce - all major consumers of energy. Second, they create uncertainty that dampens investment and economic activity more broadly.
What we're seeing in the price action now is the market beginning to price in this weakening global demand picture. The technical breakdown is essentially the market's way of discounting future economic weakness before it fully materializes in the data.
What This Means for Traders and Investors
For active traders, this setup offers several potential scenarios to consider. The most obvious is looking for short positions on rallies back to the yellow resistance line, which has now flipped from support. These technical retests often provide favorable risk-reward entry points for trades in the direction of the major trend.
For energy sector investors, this analysis suggests caution is warranted. Companies with high production costs or significant debt loads could face substantial pressure if crude continues its decline toward the $43.50 target. Conversely, well-capitalized firms with low break-even production costs may weather the storm and potentially emerge stronger when the cycle eventually turns.
Warning Signs to Watch
Could this bearish scenario be negated? Of course - markets are dynamic, and no analysis is foolproof. The key level to watch would be a decisive daily and weekly close back above the yellow trendline. That would suggest my interpretation of the breakdown is incorrect and would warrant a reassessment.
Additionally, any sudden supply disruptions from geopolitical events could temporarily override these technical patterns. However, it's worth noting that recent geopolitical tensions haven't been able to sustain meaningful rallies in crude oil - a bearish sign in itself.
Final Thoughts
The technical breakdown in WTI crude oil isn't just another minor swing in the ongoing volatility of energy markets - it represents a potentially significant change in the multi-year trend. The clear break below long-term support, the bear flag formation, and the sideways chop are all pointing to further weakness ahead.
With a target of $43.50 in sight, possibly arriving faster than many expect due to recessionary pressures and trade tensions, both traders and investors should be preparing for a challenging environment in energy markets.
Remember, in trading and investing, it's not about hoping for particular outcomes - it's about reading the probabilities presented by price action and positioning accordingly. Right now, those probabilities are suggesting a bumpy road ahead for crude oil prices.
Stay nimble, keep your risk management tight, and as always, let the chart be your guide.


