Analyzing The Bitcoin Chart Using Technical Analysis
Following the 15% fall in Bitcoin in the last week, a bounce has begun. The big question is, will this bounce turn into a bigger uptrend? Based on bigger time frames and macro factors, it is likely there is more downside in Bitcoin to come.
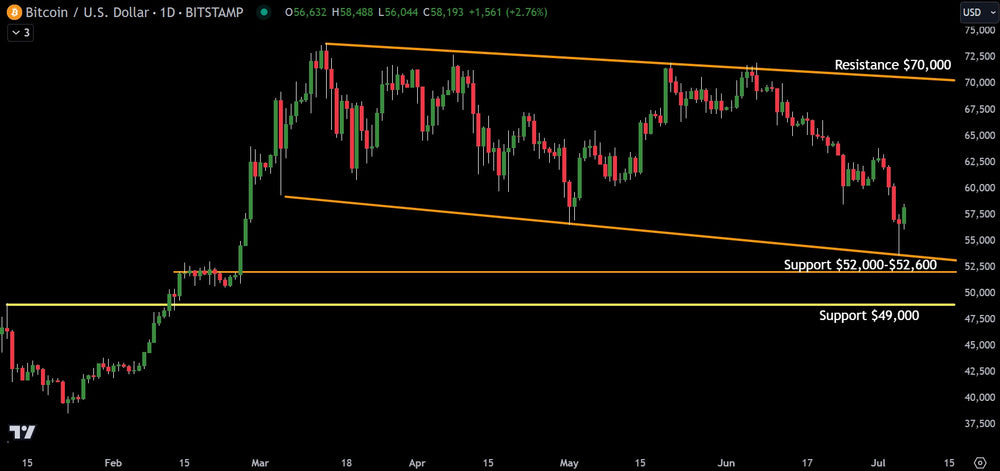
The positive for the bulls is that Bitcoin flushed into major support at $52,000 - $52,500. This zone is a kiss of the Fibonacci 0.618% as well as a downsloping trend line that connects all the lows since March 2024. Bitcoin has already bounced almost 10% off the lows and put in a near-term bottoming tail (a reversal signal).
On the bear side, Bitcoin is showing weakness even with the stock market hitting new all-time highs. Historically, Bitcoin has been a risk asset. To see major derisking already happening in the crypto sector is not a good sign for when the stock market begins to correct.
If the $52,000 - $52,500 support level is broken, a move to $49,000 is next. This would take Bitcoin back to the high made when the spot ETF was approved. It should be a bounce level.
On the upside, if price action continues to keep Bitcoin grinding higher, major resistance does not come into play until $70,000.
While Bitcoin has a shot at being the digital gold in the future, it still has major risks in the near-term from panic sellers should fear hit risk assets.
This article is intended for informational and educational purposes only and does not constitute financial advice. All trading involves risk. Past performance is not indicative of future results.
Trading involves substantial risk. All content is for educational purposes only and should not be considered financial advice or recommendations to buy or sell any asset. Read full terms of service.