Bitcoin Struggles At Major Resistance, Here Is The Analysis
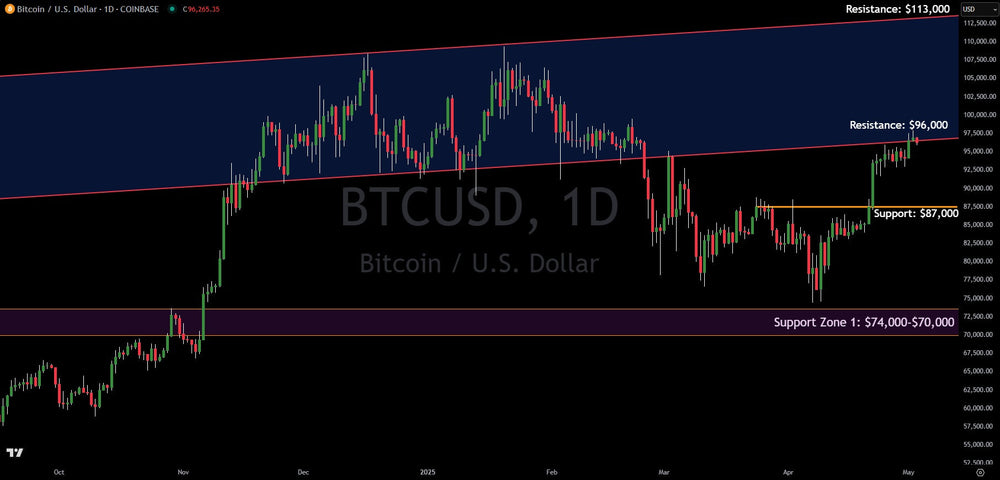
Following the recent powerful surge from the late March / early April lows around the $77,500-$80,000 area, Bitcoin has advanced aggressively, pushing right into significant resistance near the $96,000 level. This price action demonstrates considerable underlying buying pressure.
However, the rally now confronts a formidable barrier at this $96,000 zone. As clearly delineated on the chart, this level represents the lower boundary of a major upward-sloping parallel channel that has defined the broader trend. This upper parallel trend line previously capped the highs seen in late 2024 and early 2025 and connects to the 2021 high and 2017 bull market high, reinforcing its significance as resistance. Bitcoin's current price is pressed directly against this critical lower parallel trend line. Note the chart.
Looking forward, a decisive breakout and sustained trading above the $96,000 resistance level would be a strong bullish signal. Such a move would clear the immediate hurdle and open up a path towards the upper parallel trend line of the channel, currently situated near the $113,000 price target.
Alternatively, if Bitcoin is rejected at this $96,000 resistance, a retracement or pullback is the likely scenario. Initial support would be anticipated at $87,000, an area of prior consolidation. Should that level fail to hold, a deeper correction could ensue, targeting the major support zone clearly marked on the chart between $74,000 and $70,000.
Based on the current chart structure, with price having rallied sharply into a major multi-month trend line resistance, technical analysis suggests a higher probability of consolidation or a near-term pullback below the $96,000 level in the coming sessions before the next major directional move is established.


