Bitcoin Technical Analysis: BTC Nearing Epic Resistance
Bitcoin's Date with Destiny: The $113K Trendline That Could Spark a Major Top
As Bitcoin continues its relentless march higher, trading around $110,000 and captivating headlines worldwide, there's a critical technical level approaching that every serious trader and investor needs to understand. After 26 years of analyzing markets and witnessing countless cycles, I can tell you that some resistance levels are more significant than others—and Bitcoin is rapidly approaching one of the most important resistance zones in its entire history.
The Trendline That Started It All
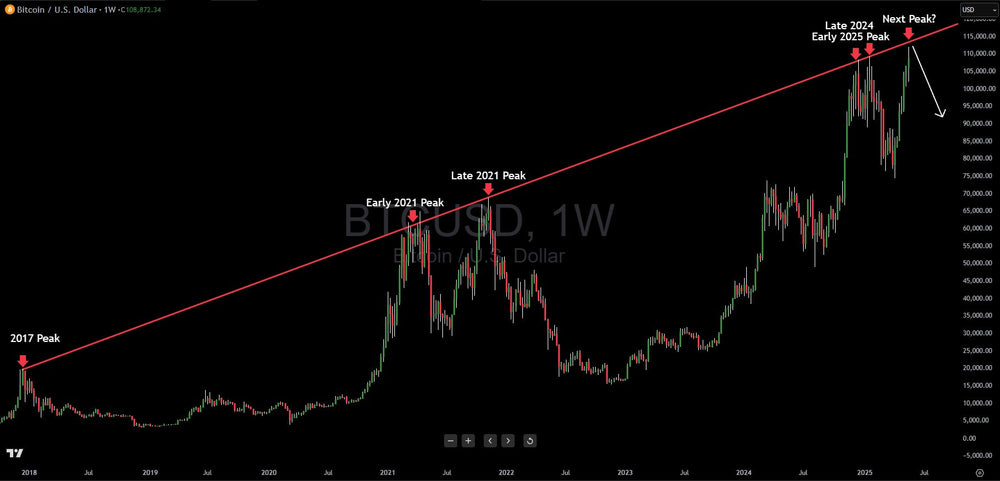
Let me walk you through what I'm seeing on this chart, because the story it tells is absolutely fascinating. We're looking at a single, massive descending trendline that connects three of the most significant peaks in Bitcoin's journey. This isn't just any ordinary resistance line—it's a trendline that began at Bitcoin's legendary 2017 peak around $20,000, the moment when cryptocurrency first truly entered mainstream consciousness.
From that historic high, this trendline drew a perfect connection through two critical peaks during 2021's explosive bull market, when Bitcoin reached its previous all-time high near $69,000. But here's where things get really interesting: this same trendline extends forward to connect with the high pivot we saw in late 2024 and early 2025, creating what technical analysts call a "three-touch confirmation."
In my experience, when you get three touches on a major trendline spanning nearly eight years of price action, you're dealing with something far more significant than typical chart patterns. This is institutional-grade resistance—the kind that reflects the collective memory of every major Bitcoin holder, trader, and institution that has participated in this market over the better part of a decade.
The $113,000-$114,000 Danger Zone
Based on the trajectory of this trendline, Bitcoin is heading straight toward a collision with this massive resistance zone at approximately $113,000-$114,000. Now, here's what strikes me about this setup: we're not talking about a horizontal support or resistance level that gets tested frequently. This is a dynamic, sloping resistance that has been building tension for years.
Think of it like a coiled spring. Every time Bitcoin has approached significant resistance in the past, it has either broken through decisively or been rejected emphatically. There's rarely a middle ground with Bitcoin at major technical inflection points. Given the magnitude of this particular trendline and its historical significance, I believe we're setting up for what could be one of the most important technical tests in Bitcoin's entire existence.
What makes this even more compelling is the timing. Bitcoin has officially kicked off a powerful rally in May 2025, smashing through its previous all-time high and soaring above $112,000, putting it right on the doorstep of this critical resistance zone. The momentum is there, the institutional interest is unprecedented, and the macroeconomic backdrop continues to support Bitcoin's narrative as a hedge against currency debasement.
Why This Could Mark a Major Top
From a psychological standpoint, this trendline represents something profound. Every investor who bought Bitcoin at or near the 2017 peak, every trader who rode the 2021 bull market, and every institution that has allocated capital to Bitcoin over the past few years will be watching this level. The collective weight of this historical resistance could prove overwhelming, even for Bitcoin's legendary volatility.
Here's what my experience tells me to watch for: when Bitcoin hits this $113,000-$114,000 zone, we're likely to see an initial rejection. The selling pressure from profit-taking, combined with the technical significance of this level, could trigger a substantial correction. I wouldn't be surprised to see Bitcoin pull back 30-40% from these levels once it hits this resistance.
This doesn't mean Bitcoin is finished—far from it. But major tops in Bitcoin tend to be followed by significant corrections that shake out weak hands and reset the market for the next leg higher. Remember, Bitcoin crashed over 80% after its 2017 peak and more than 75% after its 2021 high. These corrections are brutal but necessary for the long-term health of the market.
The Macro Case That Changes Everything
Now, here's where my analysis takes what some might consider a contradictory turn. While I'm bearish on Bitcoin's immediate prospects when it hits this trendline resistance, I remain extraordinarily bullish on Bitcoin's longer-term trajectory. Why? Because the macroeconomic fundamentals supporting Bitcoin have never been stronger.
Let's start with the United States debt situation, which has reached truly staggering levels. As of March 2025, the federal government debt is $36.56 trillion, and the trajectory is unsustainable. Right now, the United States spends over $2.6 billion per day on interest payments. Over the next 10 years, CBO estimates that interest costs will total $13.8 trillion.
These aren't just numbers on a spreadsheet—they represent a fundamental breakdown in fiscal responsibility that will inevitably require monetary solutions. Federal debt held by the public rises from 100 percent of GDP this year to 118 percent in 2035, surpassing levels not seen since World War II.
But the debt crisis isn't limited to the United States. Global debt has already hit a record $307 trillion in 2023, and global public debt is expected to exceed $100 trillion, or about 93 percent of global gross domestic product by the end of this year and will approach 100 percent of GDP by 2030.
The Inevitable Return to Money Printing
Here's what history teaches us about debt crises: they always end the same way. When governments can no longer service their debt through normal means, they turn to their central banks. Central banks have come under increasing criticism for large balance sheet losses associated with quantitative easing (QE), and some observers have also argued that QE helped fuel the post-COVID-19 inflation boom.
Despite these criticisms, Goldman Sachs and Morgan Stanley predict the Fed will stop QT in the first quarter of 2025, and when economic pressures mount—as they inevitably will given current debt trajectories—central banks will have no choice but to return to massive money printing operations.
This is where Bitcoin's long-term value proposition becomes undeniable. While politicians and central bankers can print unlimited amounts of fiat currency, they cannot print Bitcoin. The 21 million coin supply cap isn't just a technical feature—it's a fundamental guarantee that Bitcoin cannot be debased the way every fiat currency in history has been debased.
The Smart Money's Strategy
So how do we reconcile the near-term bearish technical setup with the longer-term bullish macro thesis? This is where having a clear strategy becomes crucial.
If you're a short-term trader, the approaching $113,000-$114,000 resistance zone represents an excellent opportunity to take profits or even establish short positions. The technical setup strongly suggests that Bitcoin will face significant selling pressure at these levels, potentially leading to a correction that could last several months.
For longer-term investors, however, any major correction from the $113,000+ levels should be viewed as a gift—an opportunity to accumulate Bitcoin at significantly lower prices before the next major leg higher begins. Remember, Bitcoin's corrections are violent but temporary, while the monetary debasement driving its long-term appreciation is structural and permanent.
What to Watch For
The key inflection point will come when Bitcoin actually tests the $113,000-$114,000 resistance zone. Watch for these critical signals:
Bearish Signals: Heavy volume on the approach to resistance, multiple failed attempts to break above the trendline, and divergences in momentum indicators could all confirm that this level will hold and trigger a significant correction.
Bullish Breakthrough: If Bitcoin manages to break decisively above this trendline with strong volume and holds above it for several days, it could signal the beginning of the most explosive phase of this bull market yet.
The Bigger Picture
What we're witnessing is nothing less than a monetary revolution playing out in real time. Traditional fiat currencies are being systematically debased by their respective governments' inability to control spending, while Bitcoin offers the world's first truly scarce digital asset.
The approaching test of the $113,000-$114,000 trendline will be significant from a technical perspective, but it's important to remember that technical analysis is just one lens through which to view markets. The fundamental drivers behind Bitcoin's long-term ascent—currency debasement, institutional adoption, and growing recognition of Bitcoin as a store of value—remain as powerful as ever.
My Bottom Line
We're approaching one of the most significant technical tests in Bitcoin's history. While I expect the $113,000-$114,000 trendline resistance to initially hold and potentially trigger a substantial correction, this short-term bearish view should be viewed within the context of Bitcoin's extraordinary long-term prospects.
The debt spiral consuming both the United States and the global economy is unsustainable, and the inevitable policy responses will only accelerate Bitcoin's adoption as the world's premier store of value. For traders, respect the technical resistance. For investors, prepare for the opportunity that any major correction will provide.
In my 26 years of market analysis, I've learned that the most profitable opportunities often come when short-term technical setups conflict with long-term fundamental trends. Bitcoin's approaching test of multi-year resistance represents exactly this type of opportunity—one that could define the next phase of this remarkable asset's journey.
The question isn't whether Bitcoin will eventually break through this resistance—it's whether you'll be positioned to benefit from both the volatility and the inevitable longer-term appreciation that lies ahead.
This analysis represents the views of Gareth Soloway and Verified Investing based on current technical and fundamental analysis. Markets are inherently unpredictable, and all trading and investment involves risk. Always consult with qualified professionals and never invest more than you can afford to lose.


