Bitcoin Technical Analysis: Chart Levels, Trade Signals
Bitcoin will start the week with a bullish/positive bias based purely on technical analysis. The biggest market cap cryptocurrency has been consolidating since March 13th, 2024 when it nearly hit $74,000. This sideways chop is digestion of the big move up that took price from $35,000 to $74,000.
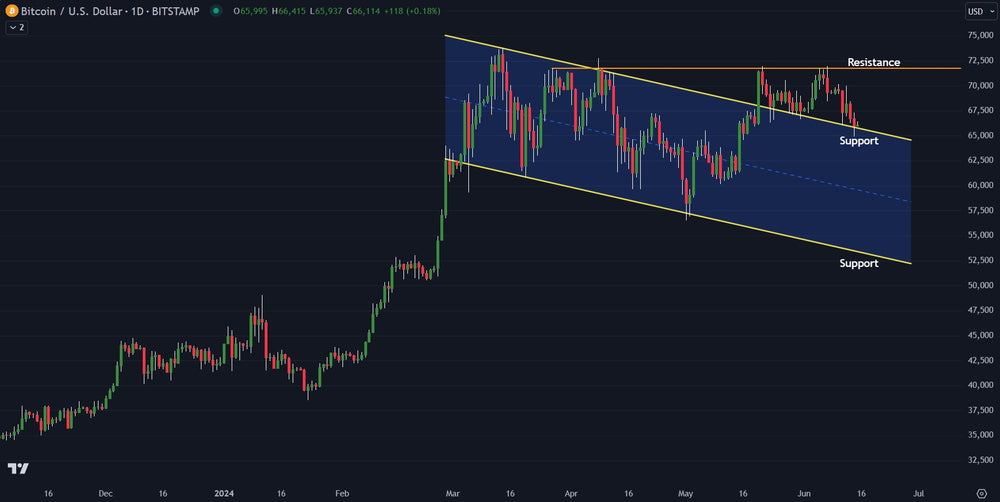
This consolidation, bullish pattern within the chart recently broke above a key level and has held, even after multiple attempts to break below. As long as this key support at $65,500 holds on a daily closing basis, the bullish bias on Bitcoin remains.
Should price move above resistance at $71,800, upside to the all-time high and beyond is likely.
Looking at the bearish case, should price have a daily close below $65,500, Bitcoin could decline very quickly toward the $50,000.
This gives specific levels for investors to trade against. Note the chart above for a visual representation of the technical support and resistance levels on bitcoin.
Trading involves substantial risk. All content is for educational purposes only and should not be considered financial advice or recommendations to buy or sell any asset. Read full terms of service.