Bitcoin Technical Analysis: Chart Support And Resistance
Bitcoin continues to hold above the bullish channel after breaking to the upside. While price is above the bullish channel, it has failed to make another substantial move higher to test the $74,000 double top. That could be coming soon.
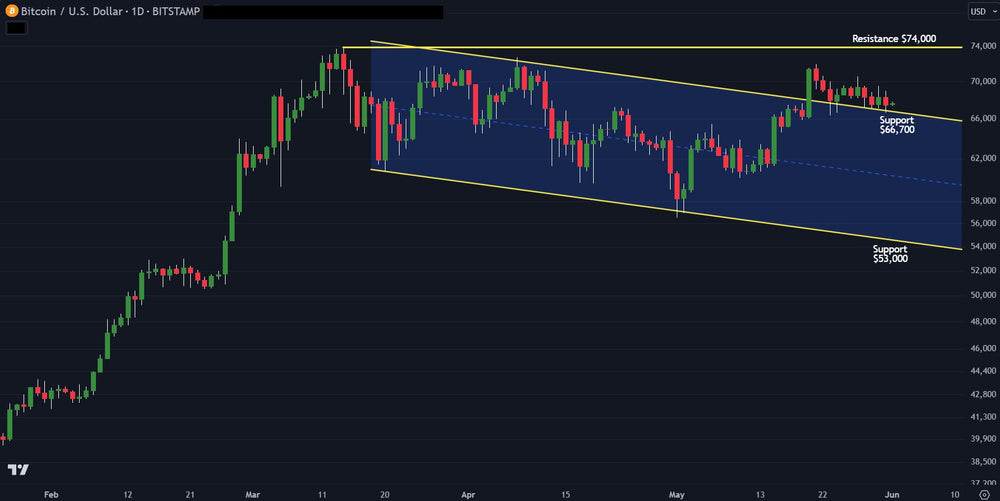
Overall, the Bitcoin chart remains net bullish based on pure technical analysis. The channel formed after a significant rally higher. When a channel forms off a surge in price (Bitcoin rallied from $38,500 to $74,000), it is called consolidation. Essentially, price is digesting the big move higher before it will likely go higher.
In the near-term, price has broken out above the channel and is sitting on top of the channel line. As long as price stays above the upper channel line, a strong bullish bias remains. Should price break back below and regain the channel, a bearish bias would take hold, potentially pushing price down to the $53,000 level.
In terms of upside, price resistance remains the previous high just below $74,000. However, the longer it consolidates here, the more likely a break above $74,000 can occur with relative ease.
Overall, the pure technical chart is net bullish. Remember, should price move back below the upper channel trend line, the probabilities shift to a bearish near-term bias.
Trading involves substantial risk. All content is for educational purposes only and should not be considered financial advice or recommendations to buy or sell any asset. Read full terms of service.


