Bitcoin's Technical Crossroads: Navigating The Charts
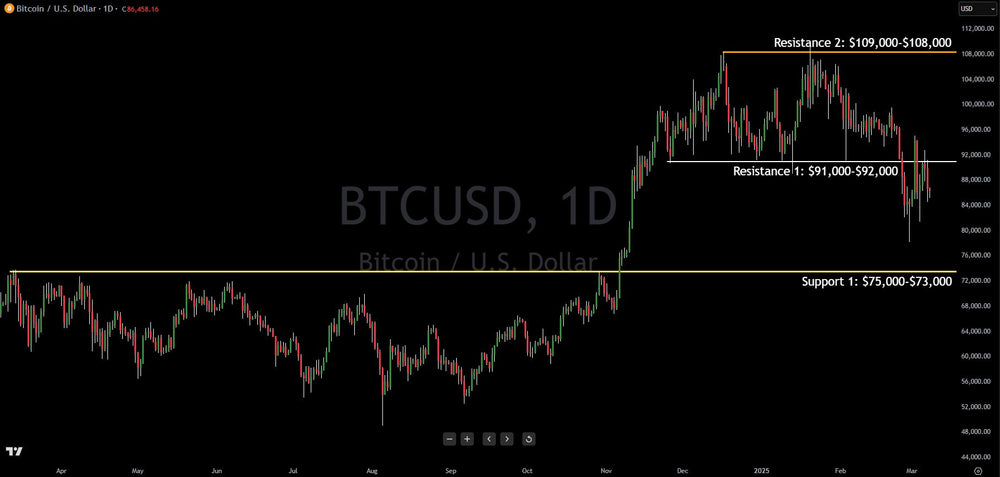
Bitcoin has entered a period of consolidation, oscillating below the critical resistance zone of $91,000-$92,000. This area previously served as a robust support level between November 2024 and February 2025, a period characterized by sustained bullish momentum. However, the subsequent breach of this support has transformed it into a formidable resistance barrier, a classic scenario in technical analysis. This transition signifies a potential shift in market sentiment, with sellers now exerting greater influence.
The inability of Bitcoin to decisively overcome this resistance zone has fueled concerns among traders and analysts. Examining the current price action, which hovers around $86,500, the probability leans towards a continuation of the downward trend. The next significant support level is identified within the $73,000-$75,000 range. This potential decline would represent a substantial correction, potentially testing the resolve of long-term holders.
Adding to the market's complexity is the recent announcement of a national Bitcoin reserve. While the establishment of such a reserve initially sparked optimism, the subsequent clarification from the U.S. government tempered expectations. The government clarified that the reserve would be populated solely with seized Bitcoin, and there are no plans for direct purchases. This distinction is crucial, as it eliminates the potential for significant market demand driven by government acquisition. The Bitcoin bulls, who had hoped for active government participation, were understandably disappointed by this development.
Key Technical Considerations:
- Resistance Zone: The $91,000-$92,000 range remains a crucial hurdle. A sustained break above this level, confirmed by robust trading volume, would invalidate the current bearish outlook and signal a potential resurgence of bullish momentum.
- Support Zone: The $73,000-$75,000 area represents the next critical support level. A decline to this range would likely trigger increased volatility and potentially attract buyers seeking to capitalize on a discounted price.
- Upside Potential: Should Bitcoin successfully breach the $91,000-$92,000 resistance, the next target would likely be the $108,000-$109,000 range, representing a significant upside potential.
- Downside Risk: Conversely, a failure to hold the current price levels could lead to a rapid descent towards the $73,000-$75,000 support, potentially triggering further selling pressure.
- Market Sentiment: The market is currently experiencing a mix of uncertainty and caution. The news regarding the Bitcoin reserve, while not wholly negative, has introduced a degree of ambiguity.
In Summary:
Bitcoin's current price action suggests a higher probability of a downward move towards the $73,000-$75,000 support zone. However, the cryptocurrency market is known for its volatility, and a sudden shift in sentiment or a significant news event could alter the prevailing trend. Traders should closely monitor the $91,000-$92,000 resistance level and the $73,000-$75,000 support zone for potential trading opportunities.
This article is intended for informational and educational purposes only and does not constitute financial advice. All trading involves risk. Past performance is not indicative of future results.
Trading involves substantial risk. All content is for educational purposes only and should not be considered financial advice or recommendations to buy or sell any asset. Read full terms of service.