Charting Crypto: Bitcoin Technical Analysis

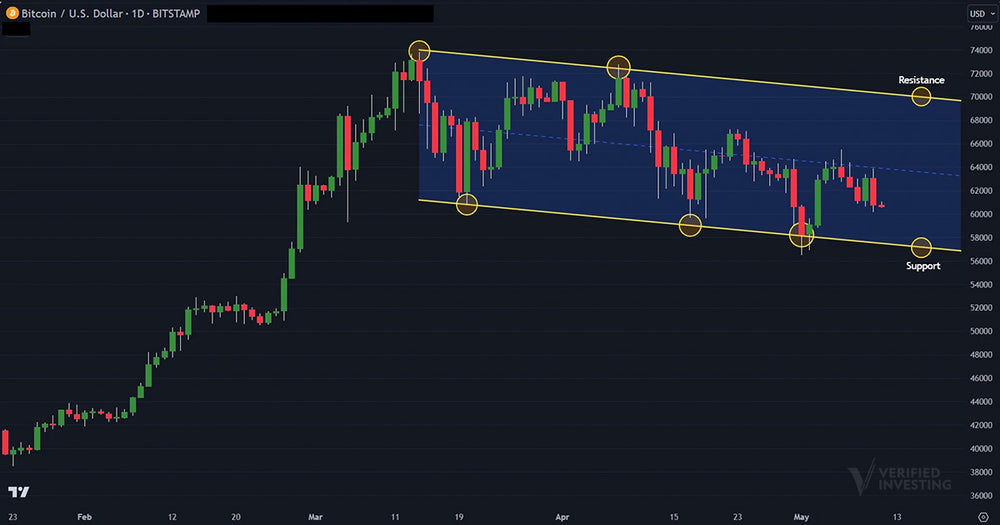
Bitcoin continues to consolidate inside a parallel channel. After the recent surge to near $74,000 on spot ETF excitement and the halving, Bitcoin has slowly pulled back to as low as $56,500. This is not unusual for Bitcoin as big moves historically yield big corrections before the next surge higher.
Using technical analysis, the parallel channel Bitcoin is in is bullish as long as price stays within it. The low end of the channel is currently $57,500 and the high end is $69,500 (these will slowly adjust over time).
The Bear Case:
If price breaks below $57,500 and does not snap back quickly, the bears will take control and push price to $52,000-$49,000. This will likely only happen if the stock market sees another risk off move (selloff).
The Bull Case:
If price holds within the parallel channel and does not break the lower end, it remains bullish. The parallel channel is called 'bullish consolidation' when it comes off a surge up like investors have seen. Consolidation is net positive as the chart is digesting the recent move. If price breaks above the upper parallel line, it should move through the all-time highs and head much higher.
Investors need to always remember technical analysis is a game of probabilities. Done correctly, investors can gain an edge, ignoring hype and emotion and putting the odds in their favor heavily.
Trading involves substantial risk. All content is for educational purposes only and should not be considered financial advice or recommendations to buy or sell any asset. Read full terms of service.


