Ethereum ETF Price Surge, Technical Chart Signals This Move Next
The last week was epic for Ethereum. The odds of an Ethereum ETF were near zero and then it all changed. The SEC approved rule changes that allow multiple ETF's to come to market. This is huge for the crypto markets and for investors.
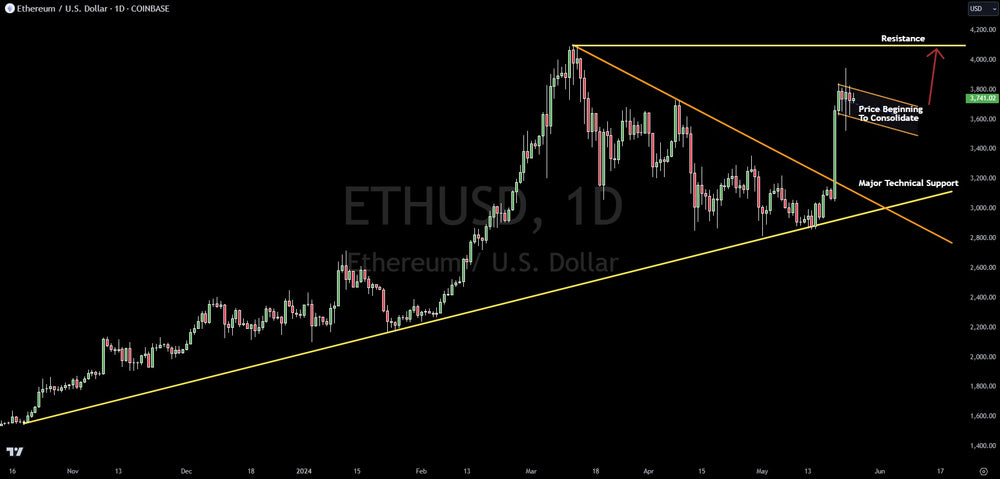
As the odds of approval shot higher early last week, Ethereum's price spiked from $3,000 to $3,800.
From that point on it, price has chopped sideways. As long as price continues to consolidate in the $3,500 to $3,800 range, probabilities remain bullish for another move higher. This is known as bullish consolidation on the Ethereum chart.
Should consolidation continue for another week or so, price will likely jump to the $4,100 double top from March, 2024.
Should price fail to hold the bullish consolidation pattern, major support would be seen around the $3,000 level.
Based on current data in the chart, investors should note that probability favors upside.
Trading involves substantial risk. All content is for educational purposes only and should not be considered financial advice or recommendations to buy or sell any asset. Read full terms of service.


