Ethereum Technical Analysis: Support And Resistance

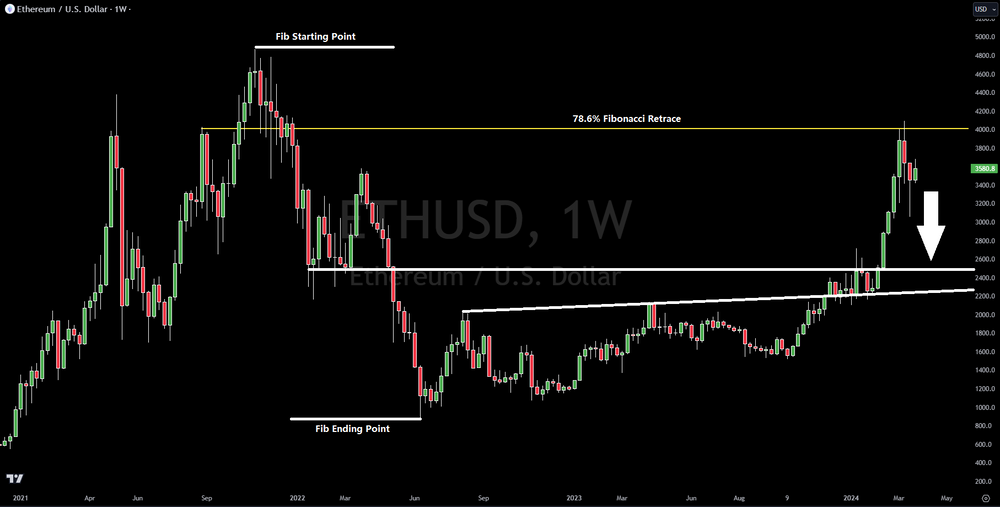
Ethereum recently topped out at just over $4,000. If you take the all-time high of $4,900 and the bear market low of $875, the $4,000 level is a perfect 78.6% Fibonacci retrace. This gives investors a good basis for resistance and the likelihood of a pull back.
When looking at the expectations for a pull back, a likely target could be $2,300-$2,500. The reason for this level being significant is not only the two trend lines seen in the chart above, but also it is the 50% retrace of the bear market low of $875 to the $4,000 high.
When there are multiple trend lines and indicators that coordinate at a specific level, it increases the odds that the level will be MAJOR support.
Trading involves substantial risk. All content is for educational purposes only and should not be considered financial advice or recommendations to buy or sell any asset. Read full terms of service.


