Solana Technical Analysis: Critical Price Levels to Watch
By Gareth Soloway, Chief Market Strategist at VerifiedInvesting.com - May 17th, 2025
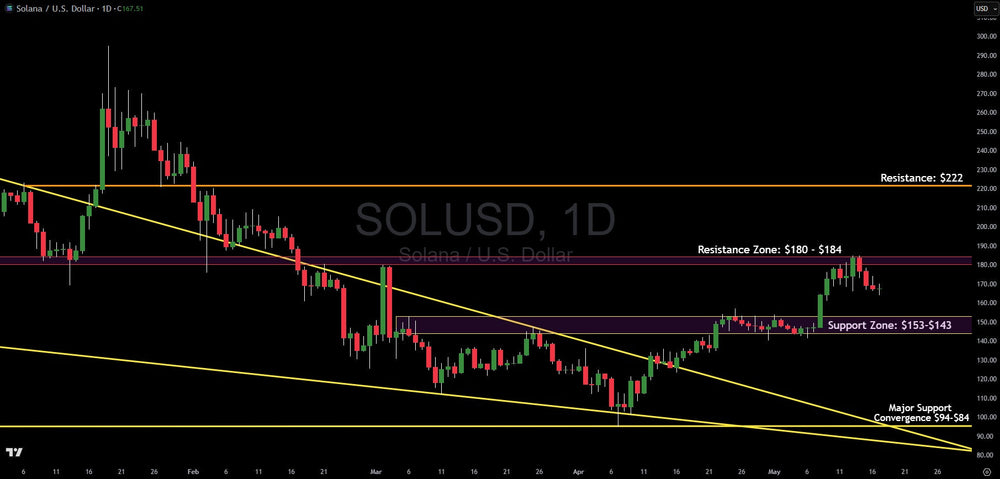
Article Summary: SOL is trapped between strong resistance at $180-$184 and support at $153-$143. Which way will it break? The answer might depend more on the stock market than you think. 🧐 #SolanaAnalysis #CryptoTechnicals
--------------------------------------------------------------------------------------------
Solana's price action has been giving us quite the technical story lately, and today I want to walk you through what the charts are telling us – and more importantly, what it means for your trading decisions. Currently trading at around $167, SOL finds itself at a fascinating inflection point that deserves our careful attention.
The Battle Between Key Support and Resistance
What immediately jumps out on the daily SOL/USD chart is the clearly defined battlefield where bulls and bears are duking it out. Price is currently trapped in a critical decision zone – sandwiched between a strong resistance zone at $180-$184 and a solid support zone between $153-$143.
This price action reminds me of two heavyweight boxers feeling each other out in the early rounds. Neither side has landed a knockout blow yet, but both are looking for an opening. When markets consolidate between well-defined levels like this, it's like a spring coiling tighter and tighter – the longer the consolidation, the more explosive the eventual breakout often becomes.
Looking at how price has interacted with our resistance zone ($180-$184), we can see it's been rejected from this level multiple times in recent weeks. Each touch of this ceiling has been met with selling pressure that pushed SOL back down. This wasn't just a casual rejection – the red candlesticks and increased volume on these rejections tell us sellers are defending this territory with conviction.
The Support Floor Holding Strong
On the flip side, the $153-$143 support zone has been acting as a reliable floor. What makes this support particularly interesting is how it's withstood multiple tests without breaking. Each time SOL has approached this zone, buyers have stepped in with enough conviction to halt the decline and push prices back up.
This is exactly the kind of behavior we want to see from a quality support level. It's not just a line on a chart – it represents real buying demand from traders and investors who see value at these prices.
The Bigger Technical Picture
Zooming out, we need to acknowledge the higher resistance level lurking above at $222. This level represents a significant hurdle that SOL will need to overcome before it can revisit its previous glory days. The presence of this resistance suggests that even if we break through the immediate ceiling at $180-$184, there's another battle waiting not too far up the road.
What's equally important – and often overlooked by less experienced traders – is the major support convergence down at the $94-$84 level. This zone represents a critical floor that, if tested, would likely attract substantial buying interest. The convergence of multiple technical factors at this level creates what I call a "magnetic price zone" – an area that tends to attract price action when nearby.
The Market Context You Can't Ignore
Now, here's where things get really interesting. The recent strength we've seen in SOL and other altcoins isn't happening in a vacuum. There's a compelling correlation with the broader market that we need to factor into our analysis.
The pullback in tariffs on many countries has sent the S&P 500 higher by over 22% – creating a decidedly risk-on environment that has benefited crypto assets like Solana. Traders are more willing to venture into higher-risk assets when their traditional investments are performing well.
But here's the double-edged sword – this correlation works both ways. If the stock market experiences a significant correction, we could see risk-off sentiment crush crypto prices. This interconnection between traditional markets and crypto is something I've been tracking closely, and it's becoming increasingly important to consider in your trading decisions.
Trading Scenarios to Consider
So, what does all this mean for traders? Let's unpack the possibilities:
Bullish Scenario: If SOL can convincingly break above the $180-$184 resistance zone (and by convincingly, I mean with increased volume and a strong daily close above this level), we could see a relatively clear path to test the $222 resistance. A breakout would likely attract momentum traders and could accelerate the move higher.
Bearish Scenario: A failure to break the resistance and a subsequent drop below the $153-$143 support zone would be concerning. If this support fails, the next significant floor isn't until the major support convergence at $94-$84 – representing a potential drop of over 40% from current levels.
Sideways Consolidation: Given the clearly defined range, we could also see continued consolidation between the resistance and support zones. This would suggest accumulation or distribution is still ongoing before the next major directional move.
Managing Risk in This Environment
Let me emphasize something I've been teaching for 26 years – managing risk is what separates successful traders from the crowd. For anyone considering a long position in SOL, the support zone at $153-$143 provides a logical area to place a stop loss. The risk is clearly defined, and the potential reward can be measured against the resistance targets.
For traders already in positions, consider your time horizon. Short-term traders might want to take profits near the resistance zone, while longer-term holders should be prepared for continued volatility as SOL navigates these critical levels.
The biggest risk factor right now isn't even on the SOL chart – it's the correlation with the stock market. Keep a close eye on major indices, as a reversal there could quickly spill over into crypto markets.
The Bottom Line
Solana is at a technical crossroads, trapped between well-defined support and resistance levels. The resolution of this range will likely determine the direction for the weeks and possibly months ahead.
What I find most compelling about the current setup is the clarity of the levels – the market has drawn its lines in the sand, giving traders well-defined areas to plan around. While I can't predict with certainty which way SOL will break, I can guarantee that monitoring these key levels will put you ahead of most retail traders who are trading on emotion rather than technical probabilities.
Remember, successful trading isn't about predicting the future – it's about recognizing high-probability setups and managing risk accordingly. With SOL, the chart is giving us the roadmap; now it's up to us to navigate it wisely.


