GBP/USD Technical Analysis: Critical Juncture as Pound Tests Major Resistance Zone
By Gareth Soloway, Chief Market Strategist at VerifiedInvesting.com - May 17th, 2025
The British Pound has been navigating a complex technical landscape against the US Dollar, and we're now approaching what I consider a pivotal moment for this forex pair. Today, I want to walk you through what the weekly chart is telling us about GBP/USD and why the current price action deserves your full attention.
The Big Picture: A Tale of Converging Forces
When I look at this weekly GBP/USD chart, what immediately jumps out is the clear formation of a major converging pattern that's been developing since 2021. This isn't just any old consolidation – we're witnessing a technical structure that's been years in the making, and it's now reaching its inflection point.
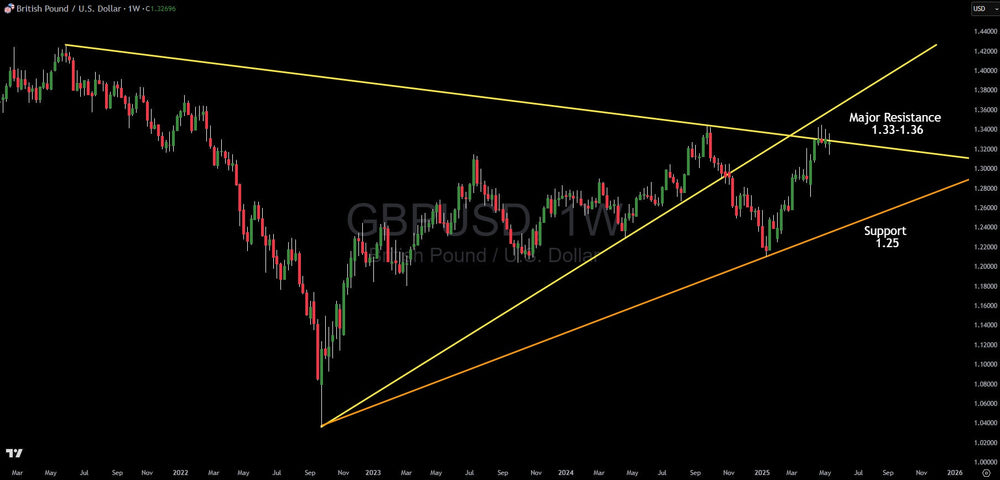
The Pound started a significant downtrend from the 2021 highs, creating our yellow descending trendline that has consistently capped rallies. Meanwhile, the currency found its footing after the 2022 lows, establishing a primary ascending support trendline (our second yellow line). These two forces – bearish resistance from above and bullish support from below – have been locked in a tug-of-war, gradually squeezing price action into an increasingly narrow range.
The Resistance Zone: Where Bulls Face Their Moment of Truth
What fascinates me about the current setup is that we've now arrived at what I call the "decision zone" – the 1.33-1.36 resistance area. This zone isn't arbitrary; it represents the convergence of those yellow trendlines I mentioned earlier. When we see major trendlines converge like this, it typically signals that something has to give. The market can't continue to compress forever.
Notice how price has recently approached this resistance zone. The bulls have made several attempts to breach it but haven't yet secured a decisive victory. This isn't surprising – convergence zones often act like magnets, drawing price toward them but then creating significant price reactions once reached.
Think of this resistance zone as a ceiling that's been reinforced multiple times over several years. Each time the bulls try to push through, they're met with increased selling pressure from traders who've been watching this level develop. It's as if the market collectively recognizes the significance of this technical juncture.
The Critical Support Foundation: The 1.25 Level
While our attention is naturally drawn to the resistance battle at 1.33-1.36, we can't overlook the importance of our support structure. The orange ascending trendline, which currently intersects near the 1.25 level, has been providing reliable support during pullbacks.
This 1.25 support isn't just a random number – it represents a floor that buyers have consistently defended. In my experience, when you see support levels that align with rising trendlines, they often carry more significance than standalone horizontal supports. Why? Because they combine the psychological importance of a round number with the directional bias of a trending market.
If we do see a rejection from the current resistance zone, this 1.25 level would be my primary area to watch for potential buying interest to reemerge. Markets rarely move in straight lines, and even in bullish scenarios, we often see prices retrace to test support before continuing higher.
Volume Considerations and Market Psychology
While our chart doesn't display volume directly, I always incorporate volume analysis into my technical readings. For GBP/USD, this means considering the relative participation of market players at key levels.
Typically, when currencies approach major resistance zones like our 1.33-1.36 area, we see an increase in volume as larger institutions begin positioning themselves. The smart money often takes profits near resistance, creating natural selling pressure. Meanwhile, late-comers and momentum traders might be piling in, creating a temporary surge in buying pressure.
This psychological battle between prudent profit-taking and new bullish positioning often leads to choppy, volatile price action near resistance – exactly what we've been seeing in recent weeks. This is normal and healthy market behavior, though it can certainly test the patience of traders looking for clean breakouts.
Potential Scenarios and Trading Opportunities
So where does this leave us as traders and investors? I see three primary scenarios unfolding from here:
- Breakout Scenario: If GBP/USD manages to close decisively above the 1.36 level on a weekly basis (with substantial volume), this would signal a significant change in market structure. Such a breakout would invalidate years of resistance and potentially open the door to tests of the 1.40 level and beyond. However, false breakouts are common at major resistance zones, so confirmation is essential.
- Rejection Scenario: The more probable outcome, based on historical price action, would be a rejection from the current resistance zone. In this case, I'd expect a pullback toward the orange support trendline near 1.25. This scenario would maintain the overall converging structure but would offer a potential buying opportunity near support.
- Consolidation Scenario: Markets sometimes choose neither direction decisively, instead opting to consolidate just below resistance. We could see GBP/USD chop sideways between 1.30-1.33 for several weeks, essentially building energy for an eventual larger move.
For the active trader, this setup presents multiple opportunities. Those with a higher risk tolerance might look for early long entries near the 1.25 support with tight stops, anticipating an eventual breakout above resistance. More conservative traders might wait for a confirmed breakout above 1.36 before entering long positions, accepting a less favorable entry price in exchange for higher probability.
Short-term traders might even consider fade trades – shorting rejections from the resistance zone with tight risk parameters, targeting quick moves back toward the middle of the range.
Risk Considerations – What Could Change This Outlook
Technical analysis works until it doesn't, and I always maintain respect for the market's ability to surprise even the most seasoned analysts. Several factors could invalidate this technical setup:
- A sharp breakdown below the orange support trendline would signal unexpected weakness and potentially open the door to tests of levels below 1.20.
- Extreme fundamental catalysts – such as dramatic shifts in Bank of England or Federal Reserve policy – could override technical patterns temporarily.
- Geopolitical events affecting risk sentiment globally could create volatility that breaks established technical structures.
The Bottom Line
The GBP/USD is at a truly fascinating juncture from a technical perspective. The convergence of major trendlines at the 1.33-1.36 zone is creating a high-probability decision point for this currency pair.
My technical analysis suggests that we'll likely see increased volatility around this level, with a bias toward initial rejection and pullback toward the 1.25 support zone before any sustained breakout becomes possible. However, markets don't follow rigid scripts, and the prudent approach involves watching for confirmation of either scenario.
For traders and investors alike, the coming weeks should provide clarity on whether the pound can finally break free from its multi-year consolidation pattern, or whether the dollar will reassert its dominance once more. Either way, the technical roadmap I've outlined should help you navigate this evolving landscape with confidence.
Remember, the best trades often come from patient observation and disciplined execution rather than attempting to predict every market move. Let price action be your guide, and position yourself accordingly as this compelling technical story unfolds.
Gareth Soloway is Chief Market Strategist at VerifiedInvesting.com with 26 years of technical analysis experience. His analyses are based on technical chart readings and do not constitute financial advice. Always do your own research and consider your personal financial situation before investing.


