Costco (COST): Prime Short Setup at Major Resistance as Economic Headwinds Mount
By Gareth Soloway, Chief Market Strategist at VerifiedInvesting.com - May 17th, 2025
As retail traders and investors navigate these increasingly complex market conditions, certain technical setups emerge that demand our attention. Today, I want to walk you through what I'm seeing in Costco's (COST) daily chart – a textbook example of a technical resistance pattern forming right as fundamental economic headwinds intensify. This convergence of technical and fundamental factors creates what I believe is one of the most compelling short opportunities in the market right now.
The Economic Backdrop: Storm Clouds Gathering
Before diving into the technicals, let's acknowledge the elephant in the room – the deteriorating economic landscape. Last quarter's negative GDP print wasn't just a random blip; it's part of a concerning trend we're seeing across multiple economic indicators. Consumer spending, which has remarkably held up through inflation and interest rate hikes, is finally showing significant signs of strain. Even membership-based retailers like Costco aren't immune to these macro forces.
What makes this particularly relevant for Costco investors is the company's premium valuation, which has been justified by its consistent growth and resilient business model. But as recession indicators flash red, that premium becomes increasingly difficult to maintain. The market hasn't fully priced in how a genuine consumer slowdown would impact Costco's growth trajectory. Remember, markets are forward-looking, and right now, they're beginning to peer into a future where the American consumer finally taps the brakes.
Technical Analysis: A Picture-Perfect Resistance Pattern
Now, let's turn our attention to what the chart is telling us – and believe me, it's speaking volumes. The daily chart of Costco reveals a textbook resistance setup that's been months in the making.
The Ascending Trendline: Support That's Starting to Bend
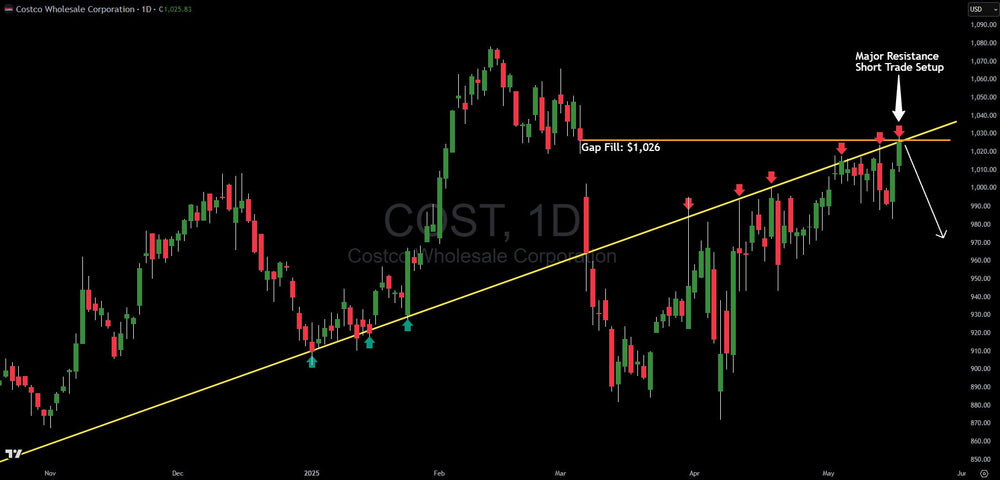
Since November 2024, COST has been riding an ascending trendline (marked in yellow on our chart) that's provided reliable support on multiple occasions. Notice the teal/green arrows marking where buyers have consistently stepped in to defend this trendline. This pattern of behavior creates a psychological floor that traders have respected – until now.
What's particularly interesting is how price action has changed in recent weeks. While the trendline hasn't broken yet, the bounces have become less enthusiastic, with shorter rallies following each touch of support. This subtle change in character suggests the buying pressure is waning – exactly what we'd expect to see before a meaningful breakdown.
The $1,026 Gap Fill Level: A Technical Ceiling
Take a look at the orange horizontal line on our chart marking the $1,026 level. This represents a previous gap that's now been filled. In technical analysis, gap fills often act as significant inflection points, and in Costco's case, this level is reinforcing our resistance zone.
The fact that price has now reached this gap fill level is significant. Markets have memory, and these prior points of interest often become magnets for price action. Now that we've reached it, the question becomes: does the stock have enough momentum to push through, or will this historical level act as a ceiling?
The Multiple Rejection Points: Sellers Taking Control
Perhaps the most telling aspect of this chart is the series of red arrows marking clear price rejections at these elevated levels. Each of these represents an attempt by bulls to push the stock higher, only to be met with determined selling pressure. One rejection might be random, but this persistent pattern tells us something important – institutional sellers are strategically unloading shares at these levels.
What I find particularly compelling is the increasing volume on many of these red candles. When prices fall on expanding volume, it signals genuine distribution rather than simply a lack of buying interest. This is the footprint of smart money positioning themselves ahead of a move lower.
The Short Trade Setup: Timing and Execution
Given this technical and fundamental confluence, let's talk about how a trader might approach this opportunity. The text annotation on our chart says it all: "Major Resistance Short Trade Setup." Here's how I'd play it:
The ideal entry zone for this short trade is between $1,025-$1,030, right where we're seeing those consistent rejection points. The beauty of this setup is that it gives us a clearly defined risk parameter – if price decisively breaks above $1,035 on strong volume, the thesis is invalidated, and we'd want to exit.
For targets, I'm looking at two key zones. The first is a return to the April lows around $970, which would represent about a 5% move. For traders willing to hold longer, the next major support zone comes in around $920-$930, where we saw strong buying interest in March.
Position sizing is critical here. Despite the compelling setup, remember that Costco remains a premium retailer with a loyal customer base. This isn't likely to be a stock that collapses 30-40% quickly unless we see a severe market-wide correction. Appropriate sizing ensures you can weather any short-term volatility without being shaken out of a good position.
Risk Factors: What Could Prove This Analysis Wrong
No analysis is complete without considering what might invalidate our thesis. A few scenarios to monitor:
- If Costco announces substantial membership fee increases that the market perceives positively, we could see renewed buying interest.
- A sudden improvement in economic data, particularly consumer spending, could temporarily boost retail stocks across the board.
- A general market melt-up driven by renewed Fed rate cut expectations could lift all boats, including Costco.
However, these scenarios seem increasingly unlikely given the deteriorating economic landscape. The consumer is finally showing signs of fatigue after remarkably resilient spending through the inflationary cycle. This fundamental shift aligns perfectly with our technical analysis, creating a high-probability setup.
Conclusion: When Technicals and Fundamentals Align
What makes this Costco setup so compelling is the rare confluence of technical and fundamental factors pointing in the same direction. The technical pattern shows us a stock reaching resistance after a prolonged uptrend, with multiple rejection points signaling distribution. Meanwhile, the fundamentals reveal an economic landscape that's becoming increasingly challenging for consumer-dependent businesses.
As traders, we're constantly searching for those special setups where multiple factors align to increase our probability of success. This Costco short opportunity checks all those boxes. The technical pattern gives us clearly defined entry points and risk parameters, while the fundamental backdrop provides the underlying rationale that could drive a sustained move lower.
Remember, successful trading isn't about hoping or guessing – it's about identifying high-probability setups and managing risk accordingly. This Costco setup offers exactly that kind of opportunity, with the potential to deliver significant returns as economic reality catches up with market valuation.


