Technical Analysis On Oil Signals Top And Downside Coming

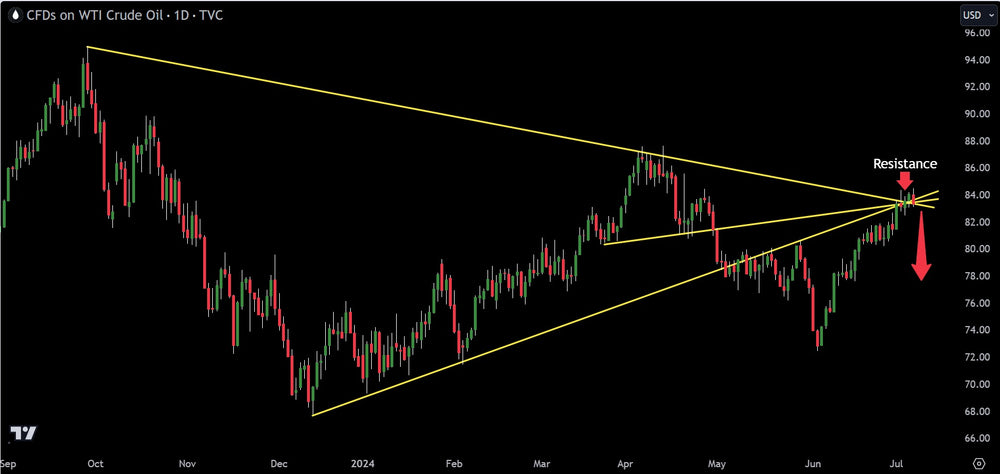
Crude oil has been floating up over the last six weeks. After bottoming out at $72/bbl, oil has consistently been pushing higher. There are a few reasons for this move $84/bbl.
The main reason for this push was an over allocation by hedge funds to being short oil. When big money gets lopsided to heavily, there tends to be a push in the opposite direction. This is mainly due to the buying pressure of many of these hedge funds covering their shorts. To cover a short, you have to buy the asset. As price goes higher, it causes more of these hedge funds to cover their shorts.
At this point, it appears balance has been restored in the oil long/short market.
A lot of talking heads will tell people the upside is due to geopolitical risk, but that has been shown to have little impact on oil prices now that the U.S. is the biggest producer in the world.
When looking at the technical analysis on the crude oil chart, price has moved into a triple resistance point. This is where there are three major trend lines converging together to for an epic resistance level at $84/bbl. Probabilities signal a pull back.
In addition, the macro environment is only worsening for crude oil demand. Not only has OPEC issued no further cuts and even put more barrels on the open market, but China has yet to recover from their economic downturn. The United States continues to see economic data that suggests a slowing economy as well. PMI data, jobs data, consumer confidence are all beginning to deteriorate. A slower U.S. economy with a slow China economy could mean $50/bbl by early 2025.
Trading involves substantial risk. All content is for educational purposes only and should not be considered financial advice or recommendations to buy or sell any asset. Read full terms of service.


