Labor Market Breakdown: Why This Technical Pattern Signals Trouble Ahead
The charts don't lie, and what I'm seeing in the weekly unemployment claims data has me deeply concerned about where we're headed as an economy. After 26 years of analyzing markets and economic data, I've learned to pay attention when technical patterns align with fundamental deterioration—and folks, that's exactly what we're witnessing right now.
Let me walk you through what this chart is telling us, and why it could be the canary in the coal mine for a much broader economic downturn.
The Setup: A Classic Breakout Pattern with Ominous Implications
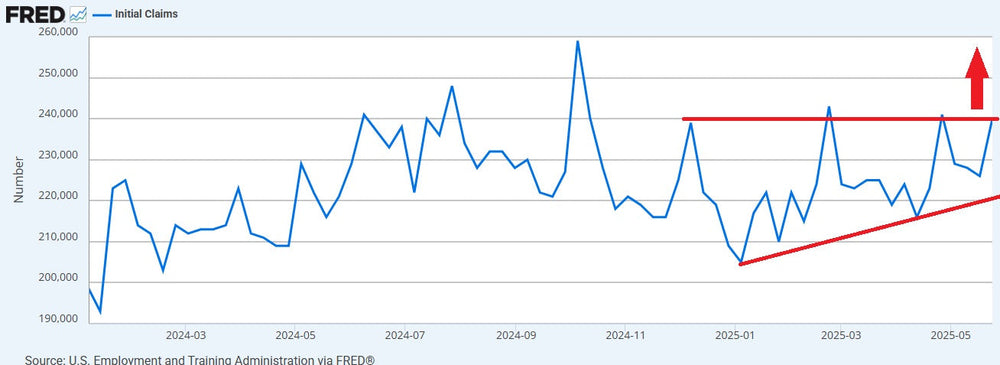
Looking at the initial jobless claims chart, we can see a textbook ascending wedge pattern forming—what technicians would typically call a "bullish" setup. There's that rising red trendline acting as support, pushing claims higher from the early 2025 lows, while overhead resistance sits firmly around the 238,000-240,000 level.
Now here's where things get interesting, and frankly, alarming. In any other market, I'd be looking for a breakout above that resistance as a bullish signal. But we're not talking about stock prices here—we're talking about unemployment claims. A breakout higher means more Americans are filing for unemployment benefits. That's not bullish for the economy; it's a warning shot that the labor market is about to crack wide open.
The pattern suggests we're coiling for a significant move higher, and when that breakout comes—and I believe it's coming soon—we could see jobless claims surge well beyond the 240,000 threshold. This isn't just a technical observation; it's backed by a mounting pile of economic evidence that suggests American consumers are running out of runway.
The Credit Card Crisis: America's Plastic Problem
While the unemployment claims are building pressure like a spring ready to snap, the credit card data is already screaming warnings. The delinquency rate for the lowest-income 10% of ZIP codes increased from 14.9% in the third quarter of 2022 to 22.8% in the first quarter of 2025, or 53% in relative terms.
Think about that for a moment. We're talking about more than one in five people in lower-income areas who are now behind on their credit card payments by 30 days or more. Credit card delinquencies also increased, with the rate of delinquencies over 90 days climbing to 12.3%, an 8.5% rise from Q4 2024 and the highest since Q1 2011.
But here's what really keeps me up at night: The share of active holders just making baseline payments on their cards jumped to a 12-year high, according to Philadelphia Federal Reserve data. When people can only afford minimum payments on credit cards with interest rates averaging over 21%, you know they're in serious financial distress.
This isn't sustainable, and when the credit crunch hits these households, guess what happens next? They lose their jobs, and that's when our unemployment claims pattern breaks out to the upside in a big way.
Auto Loans: The Wheels Are Coming Off
The auto loan market is painting an equally grim picture. According to data from Fitch Ratings, 6.6% of subprime borrowers (those with credit scores below 620) were at least 60 days past due on their car loans in January 2025, the highest since the company began collecting the data in 1994.
The average auto loan rate for a new car was 9.2% in December, and 13.8% for a used car loan, while the average monthly payment on a new-car loan rose to $623 in the fourth quarter, the highest ever.
When families are struggling with $600+ monthly car payments at 13% interest rates, combined with skyrocketing insurance costs and maintenance expenses, something's got to give. And historically, when consumers can't afford their car payments, they start losing their jobs shortly thereafter—either because they can't get to work reliably or because the companies they work for are also feeling the pinch from reduced consumer spending.
Consumer Spending: The Engine Starts to Sputter
Consumer spending, which drives nearly 70% of our GDP, is showing clear signs of fatigue. U.S. consumer spending fell for the first time in nearly two years in January, and the trend has continued. Consumer spending growth, which had already showed sluggish signs this year, slowed significantly in April as more families waited to see how tariff-related uncertainty might play out.
What strikes me here is the breadth of the pullback. Americans spent more on services like housing, utilities and health care, but they pulled back sharply on cars, clothing and appliances. This tells me consumers are prioritizing essentials while cutting discretionary spending—classic recessionary behavior.
Even more telling: Families are also saving more, setting aside 4.9 percent of their incomes, compared with 4.3 percent in March. When consumers start saving instead of spending despite low unemployment, it usually means they sense trouble ahead.
The Trade War Wild Card: Uncertainty Breeds Recession
The trade war situation has injected a massive dose of uncertainty into an already fragile economic picture. In early 2025, the Economic Policy Uncertainty Index reached its highest levels this century. And we all know what uncertainty does to business investment and hiring decisions—it kills them.
Americans watching the turmoil with tariffs have begun pulling back on spending, as President Donald Trump's trade war continues to stir up economic uncertainty. The psychological impact here can't be understated. When consumers lose confidence, they stop spending. When they stop spending, businesses start laying people off. When businesses start laying people off, our unemployment claims pattern breaks out higher.
The IMF has already warned that global economic growth will experience a "significant slowdown" in 2025 as President Trump attempts to reshape global trade with tariffs, with the odds of a US recession have risen to 40%.
The Perfect Storm: Multiple Warning Signals Converging
What we're witnessing isn't just one isolated problem—it's multiple economic stress points converging simultaneously. The technical pattern in unemployment claims is simply the culmination of broader economic deterioration that's been building for months.
Consumer sentiment plummeted to the second-lowest level on records going back to 1952, while businesses are delaying investment due to policy uncertainty. Credit markets are showing stress across multiple consumer categories, and the trade war is adding volatility to everything from supply chains to currency markets.
Even the Federal Reserve is taking notice. Recent data suggests they're preparing for a potential economic slowdown, with recession probabilities models showing about 51 percent chance of recession within the next year.
What This Means for the Months Ahead
The ascending wedge pattern in unemployment claims isn't just a technical curiosity—it's a warning that the labor market foundation is starting to crack. When you combine deteriorating consumer finances, record-high delinquencies across multiple debt categories, slowing spending, and unprecedented policy uncertainty, the stage is set for a significant economic downturn.
I've been through enough market cycles to recognize when the pieces are falling into place for a major move. The unemployment claims chart is telling us that we're likely just weeks or months away from a breakout that will confirm what the economic data is already suggesting: the labor market is about to face serious headwinds.
For traders and investors, this means preparing for increased volatility and potentially defensive positioning. For everyday Americans, it means being prudent with spending and building emergency savings if possible.
The pattern is clear, the fundamentals support it, and the timing seems to be aligning. When that unemployment claims resistance finally breaks—and I believe it will—we could see a rapid acceleration in jobless filings that catches many people off guard.
Sometimes the most important signals come from the charts that nobody's watching. This is one of those times, and the message isn't pretty. The labor market reckoning may be closer than most people think.
This analysis represents the views of Verified Investing and should not be considered as investment advice. Market conditions can change rapidly, and past performance does not guarantee future results.


