10 Year Yield Chart Signals Weak Economy Coming

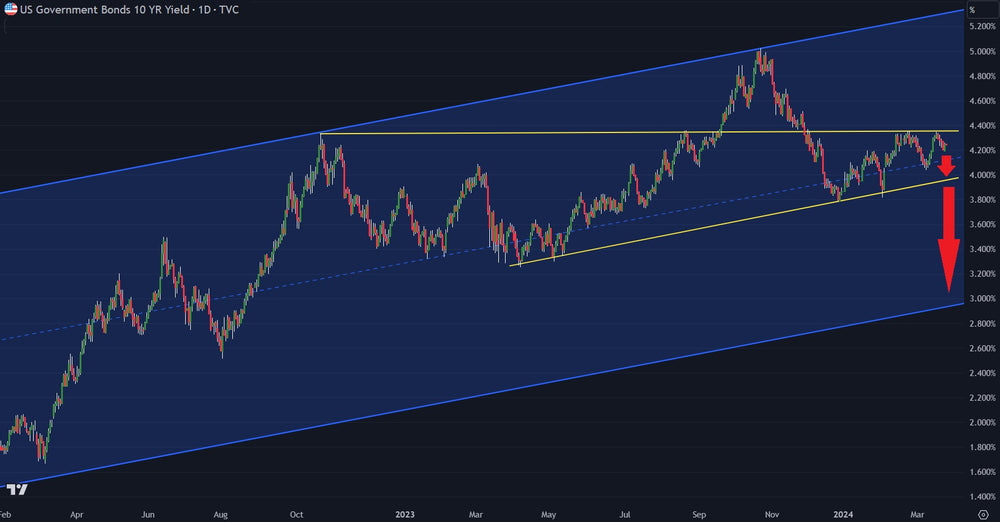
The 10 year yield chart is indicating a sharp down move in yields is likely. Considering the 10 year yield is already factoring the Federal Reserve rate cuts into next year, this signals major economic trouble that will force the Fed to cuts rates more aggressively.
The 10 year yield has been chopping between 4% and 4.4%. Note the two yellow trend lines in the chart keeping price in a tight range. However this sideways chop is called a bear flag. Now note the bigger channel. The bear flag signals a drop and once the yellow trend line of support is broken, yields near 3% are likely.
Again, with inflation being stubborn, this indicates the Federal Reserve will be facing a sharply weaker economy and have to act more aggressively. While lower interest seem good for stocks, historically the stock market drops when the Federal Reserve starts cutting rates.
Trading involves substantial risk. All content is for educational purposes only and should not be considered financial advice or recommendations to buy or sell any asset. Read full terms of service.


