My Trading Game Plan Revealed - 06/02/2026: AI Bubble, Semiconductor Frenzy, and Market Risks

Market euphoria is no longer evenly distributed. While the major indices hover near highs, leadership is narrowing into a small group of AI and semiconductor names, and the technical warning signs are building beneath the surface. In this morning’s My Trading Game Plan show, Gareth Soloway, Chief Market Strategist at Verified Investing, unpacked the extreme technical divergences, the rising corporate financing costs, and the critical levels traders must watch as this unprecedented market cycle unfolds.
As Gareth frequently reminds his viewers, "Logic and charts beat hype and narratives every time." Today's article dives deeper into the technical setups, historical parallels, and psychological drivers behind the current market environment, providing a comprehensive roadmap for navigating these volatile conditions.
AI Euphoria: When Hype Starts Repricing Fundamentals
The most glaring story in the markets today revolves around the sheer velocity of the semiconductor trade. Marvell Technology (MRVL) surged an astonishing 25% overnight following comments from Nvidia CEO Jensen Huang at a conference in Taiwan. Gareth highlighted those comments as helping fuel speculation around Marvell’s long-term AI opportunity.
To put this into perspective, Marvell surged sharply after comments Gareth highlighted from Jensen Huang at Computex, adding tens of billions of dollars to its market capitalization in a matter of hours. The stock had already posted a substantial multi-month gain from its March lows—and was extending further in pre-market trading. This is the kind of price action commonly associated with late-stage speculative behavior, where narrative is repricing stocks faster than fundamentals can justify.
Gareth drew a direct historical parallel to 2021, when Cathie Wood assigned a $4,000 price target to Tesla amid peak EV euphoria. Following that extreme price target, Tesla eventually suffered a 75% correction. When price action begins to detach from underlying earnings and is instead driven by “trillion-dollar” soundbites, the risk of a severe mean reversion grows significantly.
The euphoria isn't isolated to Marvell. Hewlett-Packard Enterprise (HPE) surged 25% on earnings, capping off a 200% move from its February 24th lows. From a technical standpoint, the momentum indicators on these stocks have reached levels that defy historical precedent.[C1]
"…we're literally looking at RSIs on the monthly chart on some of these that are at 99. I've never seen that before in my life, on a large cap, 99 RSIs on the monthly. Incredible," Gareth noted.
The Relative Strength Index (RSI) is a momentum oscillator that measures the speed and change of price movements. Traditionally, a reading above 70 indicates an asset is overbought. To see a monthly RSI of 99 on a large-cap stock is a statistical anomaly. It indicates a vertical, parabolic advance completely devoid of natural market pullbacks. While bubbles can remain irrational longer than traders can remain solvent, an RSI of 99 is a blaring siren for risk management.
Market Breadth: A Dangerous Divergence
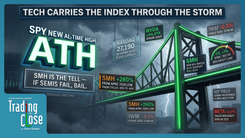
While the AI trade captures the headlines, the broader health of the S&P 500 is flashing warning signs. Yesterday, despite the major indices hitting all-time highs, market breadth was overwhelmingly negative—more stocks closed down than up.
"…the breadth of the market, the leaders, the companies hitting new 52-week highs are so small, basically relegated to the AI trade, while more and more companies are hitting 52-week lows…" Gareth explained.
This phenomenon is known as a “thin rally.” When a market is healthy, participation is broad; the “troops” follow the “generals.” Gareth warned that market leadership has become highly concentrated in a small group of AI and semiconductor names, echoing the kind of narrow participation often seen late in momentum cycles—including during the peak of the dot-com bubble.
For the S&P 500, the technical line in the sand is clear. The index has been hopping and skipping along a critical upward trend line. A daily close below 7,590 would place the market on high alert for a broader breakdown. If that support fails, traders should look for a minor pullback to previous pivot support at 7,500. Should the selling accelerate, deeper drawdown targets sit at 7,330, with a potential 50% macroeconomic retracement targeting the 7,100 level.
Similarly, the tech-heavy QQQ (NASDAQ 100 ETF), which has rallied 35% off its March 30th lows, is riding its own parallel trend line. A daily close below $735 on the QQQ would be the technical trigger indicating that the tech trade is finally in trouble. Until those levels break, the trend remains your friend, but the underlying weakness in market breadth suggests traders should keep their stops tight.
Alphabet’s AI Capital Raise and the Software Ripple Effect
A significant Alphabet financing headline hit the market today, with Gareth framing it as another sign of just how capital-intensive the AI infrastructure race has become. Alphabet shares fell 2% to 2.5% as investors digested the implications, while Broadcom rallied on expectations that chip suppliers could benefit from continued AI infrastructure spending.
Interestingly, Broadcom—a key chip supplier to Alphabet—surged 6% on the news, as investors front-ran the expectation that a significant portion of Alphabet’s capital would flow toward chip procurement. Broadcom, already a $2 trillion company, is approaching a massive technical trend line between 490 and 495 heading into its Wednesday earnings report. Historically, a stock hitting this type of resistance trend line has a 75% probability of a drawdown. However, as Gareth pointed out, in the current emotional, AI-driven market, those odds are closer to 50/50.
The ripple effects of Alphabet’s capital raise are being felt across the software sector. Oracle, which recently enjoyed a massive three-bar surge, is pulling back sharply today, alongside Microsoft. The market is waking up to a key reality: if a cash-rich behemoth like Alphabet needs to raise significant external capital just to keep up in the AI arms race, the infrastructure costs required are staggering. This implies that software companies will likely need to take on meaningful amounts of debt to finance their own AI buildouts.
This corporate debt dynamic mirrors the broader macroeconomic picture. The U.S. government is currently paying $1.2 trillion in interest alone on its $39 trillion national debt. As corporate debt rises in a higher-interest-rate environment, profit margins will face increasing pressure. It is worth noting that Berkshire Hathaway is currently sitting on the largest cash pile in its history. When the most seasoned, cycle-tested investors in the world are hoarding cash, retail traders should take note.
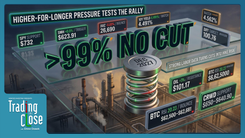
The Yield Curve and the "Boy Who Cried Wolf"
The macroeconomic picture remains heavily influenced by the bond market and geopolitical tensions. Yesterday, the 10-year Treasury yield surged back above 4.5% following the breakdown of U.S.-Iran talks and escalating conflicts in the Middle East. Higher yields typically pressure growth stocks, as they discount the present value of future earnings.
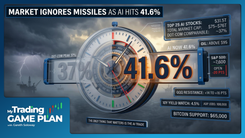
However, overnight, the U.S. administration announced that a deal was "near," causing oil and the 10-year yield to pull back. Gareth astutely pointed out the psychological shift occurring in the markets regarding these headlines: the market is developing a "boy who cried wolf" syndrome.
After countless announcements of imminent deals that fail to materialize, the market is beginning to ignore the geopolitical noise. While these events have real-world consequences—particularly for retail consumers at the gas pump—algorithmic trading and institutional money are increasingly tuning out the headlines, focusing instead on the AI momentum trade. This desensitization is common in late-stage market cycles, where participants become hyper-focused on a single narrative (AI) to the exclusion of traditional macro risks.
Bitcoin: The Leading Indicator Breaks Down
One of the most crucial technical warnings discussed in today's show comes from the cryptocurrency market. Throughout previous market cycles, Bitcoin has served as a highly reliable leading indicator for risk assets, often topping out before equities and bottoming before them.
Gareth had previously identified the $80,000 to $85,000 zone as a major upside target, and Bitcoin has since rolled over from that area, dropping 17% since May 6th.
The breakdown is technically significant. Bitcoin is currently searching for support around $65,700, but the chart suggests a high probability of further downside toward $60,000, or even the $50,000 level. Bitcoin is behaving as though a deeper cyclical correction may be underway.
This raises a fascinating psychological and flow-of-funds question: is the speculative retail money that previously fueled the crypto boom simply rotating into semiconductor stocks like MRVL, CRDO (which ran from $87 to $244), and NVDA?
If Bitcoin is indeed front-running the broader market, its current weakness is a significant warning. If and when mean reversion hits the semiconductor space, the resulting panic could trigger a broad-based liquidation event. As we saw during the COVID-19 crash, when true market panic sets in, correlations go to one—investors sell everything, including safe havens like gold, to raise cash.
Precious Metals: Wedges and Flags
Speaking of safe havens, the precious metals sector is currently offering distinct technical setups that require patience.
Gold is forming a classic wedge pattern, tightly sandwiched between its 50-day and 200-day moving averages. A wedge pattern represents a contraction in volatility—a coiled spring that eventually resolves in a violent breakout or breakdown. Traders should remain neutral on gold until a definitive daily close occurs outside of this moving average sandwich, which will dictate the next major directional trend.
Silver, conversely, is painting a more bearish picture. The metal is consolidating in a bear flag pattern. Bear flags are continuation patterns that occur after a sharp decline; the asset drifts slightly higher on low volume before breaking down to new lows. The technical downside targets for silver remain intact.
Meanwhile, natural gas attempted a breakout but failed, pulling back into its previous range. This perfectly illustrates the Verified Investing methodology: Gareth took profits on natural gas with Smart Money Commodity members at the highs, avoiding the subsequent rejection. Trading is not about marrying a position; it is about extracting capital at predetermined technical levels.
Conclusion: Discipline in a Market of Extremes
Navigating a market where a single stock can jump 200% on a CEO’s passing comment, while the broader market breadth deteriorates, requires strict commitment to technical analysis and risk management.
"…until we see a corrective move, lower lows and lower highs being put in, you really don't know when this party stops," Gareth warned.
This is the ultimate truth of probability-based trading. We cannot predict the exact day the AI bubble will pop, nor can we predict how high an RSI can stretch before gravity takes hold. What we can do is identify the critical trend lines—like 7,590 on the S&P 500 and $735 on the QQQ—and manage our risk accordingly.
By ignoring the hype, respecting the charts, and understanding the macroeconomic undercurrents of rising corporate financing costs and yield pressure, traders can manage risk during the euphoria and be prepared to act if and when mean reversion begins. Stay disciplined, trust your levels, and let the charts dictate your game plan.
Trading involves substantial risk. All content is for educational purposes only and should not be considered financial advice or recommendations to buy or sell any asset. Read full terms of service.