My Trading Game Plan Revealed - 10/05/2026: Yields Surge and Dollar Strength Threaten S&P Rally; Bitcoin Eyes $98K

Rising Yields Are the Signal the S&P 500 Is Ignoring
The most important chart in this morning’s market may be the 10-year Treasury yield.
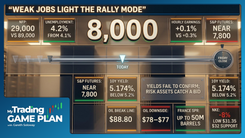
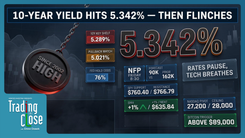
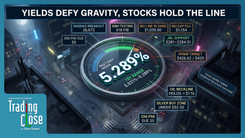
Geopolitical and political uncertainty continues to build around the world, the type of backdrop that would normally increase demand for U.S. Treasuries and push yields lower. Instead, the opposite is happening. The 10-year yield pushed through 5.3% this morning and reached 5.311%, challenging a resistance area that dates back to 2007. At the same time, the U.S. dollar continues to strengthen while the S&P 500 remains roughly 1% from its all-time high.
That disconnect is the game plan. Stocks have not broken, but the pressure surrounding them continues to build. Until price confirms otherwise, the S&P 500 deserves the benefit of the doubt. But the combination of rising yields, a stronger dollar, deteriorating market breadth and weakening commodity charts is giving traders plenty of reasons to pay attention beneath the headline index.
10-Year Treasury Yield Breaks Above 5.3% as U.S. Dollar Strengthens
The 10-year Treasury yield pushed to 5.311% this morning, putting it against a technical area with very little recent precedent. The resistance being tested goes back to the 2007 peak. A sustained breakout above it would force traders to look back roughly 24 years, toward 2002, for comparable levels.
What makes the move more important is the backdrop. With political and geopolitical uncertainty elevated, Treasury demand would normally increase as investors seek safety. Bond prices would rise and yields would fall. That has not happened.
As Gareth explained during the show, “All of this unrest with political stuff going on, you would think that would increase the demand for bonds, U.S. Treasuries, and drive yields down. But it’s not happening yet, at least. And that is going to be problematic for the markets.”
The dollar is reinforcing that signal. The DXY has pushed above 102.5 and reached a 17-month high. Higher yields and a stronger dollar both tighten financial conditions. Neither guarantees that stocks have to fall immediately, but together they raise the hurdle for risk assets to keep moving higher.
That makes upcoming economic data especially important. ISM services and the Fed minutes could either reinforce the move in yields or finally give bonds a reason to catch a bid.
S&P 500 Holds Near Record Highs as Equal-Weight RSP Weakens
The headline S&P 500 continues to resist the pressure. Futures were down only modestly this morning, and the index remains roughly 1% below its all-time high. Technically, that keeps the broader bullish structure intact.
The more revealing chart may be the Equal Weight S&P 500 ETF, RSP.
Unlike the standard S&P 500, where trillion-dollar companies can dominate index performance, RSP gives each component roughly the same influence. That removes some of the masking effect created by mega-cap technology stocks and gives traders a cleaner look at market breadth.
That chart has been considerably weaker.
Gareth continues to watch roughly $205 on RSP as a major support area. A move into that level would put the equal-weight index more than 8% below its August near-term high, even while the headline S&P remains close to record territory.
That is the divergence that matters. The market has not confirmed a broad risk-off move because the S&P 500 itself continues to hold. But fewer stocks are carrying the rally. If yields remain elevated and breadth continues to deteriorate, the burden increasingly falls on the mega-cap leaders to keep the index afloat.
Brazil ETF EWZ Breaks Out as Alibaba and Baidu Build Technical Setups
Not every market is struggling under the current macro backdrop. Brazil produced one of the strongest technical moves on Gareth’s screen this morning, with the EWZ ETF jumping roughly 13% following the election result.
The move broke EWZ out of a long-term wedge stretching back toward the 2010 high. That does not mean chasing a 13% gap higher. The more interesting setup comes if price eventually retraces toward the breakout area and proves that former resistance has become support.
Petrobras showed a similar structure, gaining roughly 8% after breaking above a parallel channel that had contained price since 2025. In both cases, the initial breakout has already occurred. The next question is whether a pullback creates a cleaner entry with defined risk.
China is presenting almost the opposite setup. Instead of breaking out after strength, several Chinese names are attempting to build structures after prolonged weakness.
Baidu is testing the lower end of a major parallel channel, while Alibaba has broken a descending trendline and returned to test the breakout area. Around \$100, Alibaba also has ascending and descending trendlines converging, with a potential larger inverse head and shoulders developing in the background.
The important word is potential. The pattern does not become actionable simply because it resembles an inverse head and shoulders. Confirmation still requires a neckline breakout. Until then, the chart is building a setup, not completing one.
Intel Stock Drops Toward Key Support at $107 to $108.50
Intel was down roughly 4% to 5% this morning following reports that Elon Musk’s Terafab project could use Taiwan Semiconductor rather than Intel for wafers and chips. The headline is negative, but for a trader the more useful question is where the selling runs into technical support.
Gareth identified a gap fill near $108.50 that overlaps with previous pivots. Combined with additional support near $107, that creates a defined zone between approximately $107 and $108.50.
“There is a gap fill at $108.50 right here, which actually is very enticing because it’s also this pivot here,” Gareth said. “This whole area between this $108.50 and $107 level, a huge amount of support on Intel for today’s day trading day.”
That is where patience matters. A stock being down sharply does not make it a buy. The trade becomes more interesting when price reaches a predetermined area where multiple technical signals converge. Instead of guessing where the selloff ends, the chart gives traders a zone where the risk/reward begins to improve.
Gold and Crude Oil Test Major Support as Breakdown Risk Builds
Gold remains above its longer-term trendline, so support still gets the benefit of the doubt. The problem is what price is doing directly on top of that support.
After last week’s selloff, gold has begun forming inside bars following a down candle, creating a potential bear flag. As long as the long-term trendline holds on a daily closing basis, the support remains valid. A confirmed break changes the structure.
“If we break down, you’re likely going back down below $4,000,” Gareth said. “If that breaks, you have $3,500 or so written all over gold.”
Silver is dealing with a similar decision, holding longer-term support while consolidating after weakness. Neither metal has confirmed the breakdown yet. That distinction matters because support is support until price proves otherwise.
Oil may be even closer to forcing a decision. Crude has spent much of the year around the $90 to $95 range and is now repeatedly testing a critical trendline near $89.
Gareth compared the repeated tests to trying to break down a door. The first hit may do very little. Hit it enough times, however, and the structure weakens.
That is exactly what traders need to watch at $89. Buyers have defended the level repeatedly, but every test potentially consumes more of the demand sitting there. If \$89 finally gives way, the chart opens the door to roughly $79 to $78. Natural gas, by contrast, has recovered above short-term support and maintains the stronger technical posture within energy.
Bitcoin Tests $87,300 Resistance With $98,000 Target in Play
Bitcoin has one of the cleanest if/then setups on the board.
The upside level is $87,300. Bitcoin has tested that resistance multiple times, but a breakout should not be assumed before price confirms it. A daily close above $87,300 would trigger the pattern and put the measured move around $97,000 to $98,000.
If Bitcoin rejects resistance, $81,300 becomes the level that needs to hold. That area previously acted as resistance and has the opportunity to become support following the breakout.
“Essentially, we break here. You probably go to $97,000, $98,000,” Gareth explained. “On the other side, if we come down here, we’ve got to hold support, or it goes back to $75,000 or so.”
That gives traders a defined map instead of a prediction. Above $87,300 on confirmation, the chart opens toward $97,000 to $98,000. Below $81,300, the recent structure begins to fail and roughly $75,000 comes back into play.
Rising Treasury Yields Put S&P 500 Resilience to the Test
The S&P 500 is still holding up, so the charts have not given traders permission to declare the rally over. But the signals underneath the index are becoming harder to ignore.
The 10-year yield above 5.3% is the centerpiece. It is rising despite a backdrop that would normally favor Treasury demand, while the dollar strengthens and the equal-weight S&P materially underperforms the headline index. Gold and oil are sitting on important support, and Bitcoin is compressed between two levels that should define its next major move.
That does not mean front-running a breakdown. It means recognizing where the pressure is building and knowing exactly what would confirm it.
For now, the market’s message is unusually clear: the headline indexes are holding, but the internals are being tested. If yields continue higher and support begins breaking elsewhere, the S&P 500’s resilience becomes much harder to sustain.
Trading involves substantial risk. All content is for educational purposes only and should not be considered financial advice or recommendations to buy or sell any asset. Read full terms of service.