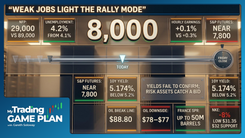
My Trading Game Plan Revealed - 10/07/2026: Rising Yields, S&P 500 to 8000 and Key Gold Crypto Levels

The biggest question facing markets this morning is not whether yields are rising. They are. The more important question is whether those rising yields are finally strong enough to break chart structures that, so far, continue to hold.
The U.S. 10-year Treasury yield pushed above 5.3% Wednesday as a global bond selloff intensified, with French government bonds under particular pressure from fiscal and political concerns. The Wall Street Journal That move pressured U.S. equities after the S&P 500 had just set a fresh record Tuesday.
For Gareth Soloway, Chief Market Strategist at VerifiedInvesting.com, that creates the defining tension in today's market: the macro backdrop is becoming increasingly difficult, but price has not yet confirmed the bearish outcome that backdrop might suggest.
That distinction matters across nearly every chart he is watching.
The Bond Market Is Becoming the Pressure Point
The 10-year Treasury yield is again pressing toward 5.35%, putting borrowing costs and equity valuations back in focus.
France is part of the story. Fiscal concerns and political unrest have pushed French yields sharply higher and widened the spread between French and German government debt. At the same time, U.S. Treasury yields have moved back toward multidecade highs.
But Gareth sees something larger developing underneath those individual catalysts: competition for capital.
SpaceX, for example, is reportedly seeking \$40 billion in financing led by Apollo Global Management to fund purchases of Nvidia chips. The proposed package includes roughly \$10 billion in bank loans and \$30 billion in investment-grade debt.
For Gareth, issuance on that scale helps illustrate why the supply side of the bond market matters.
"When you look at yields, and yields are staying high, why? Because there's an overabundance of debt being sold, not only US Treasuries, but then tons of debt coming out of the private sector or companies like SpaceX… investors can be picky and choosy about what they buy."
His point is not that one corporate financing deal determines Treasury yields. It is that governments and corporations are increasingly competing for investor capital at a time when debt issuance is already enormous. More supply can give buyers greater leverage to demand attractive yields.
And today's economy carries considerably more debt than it did during previous high-rate periods. That makes the market's sensitivity to borrowing costs an important part of the current macro framework.
The S&P 500 Has Not Broken
This is where the charts complicate the bearish macro story.
The S&P 500 traded above its August 13 record Tuesday and closed at a new all-time high of 7,818.93 before pulling back Wednesday as Treasury yields moved higher.
That pullback matters, but it has not yet broken the larger bullish structure.
Gareth continues to watch the 8,000 area as a potential upside technical objective because two long-term trend lines converge near that zone. One connects a series of major highs beginning in 2024. Another extends from the 2020 COVID low through subsequent major pivots.
That second line carries particular weight because of its age.
"The general rule of thumb is that a trend line that goes back further has more weight to it."
Two independently derived trend lines converging around the same area make 8,000 more significant than an arbitrary round-number target. It is better viewed as a major resistance zone if price gets there, not as a guaranteed destination.
For now, that leaves the S&P caught between two forces: deteriorating pressure from yields and a chart that has not yet surrendered its bullish structure.
The Macro Warning Is Bigger Than Today's Selloff
Gareth's longer-term concern extends well beyond Wednesday's trading.
The IMF is warning about elevated public debt and risks surrounding the enormous capital requirements of the AI buildout, while geopolitical tensions continue to complicate the global outlook.
Gareth views developments like the turmoil in European bond markets as "breadcrumbs," smaller signs of the structural debt problem he believes could become much more serious toward the end of the decade.
He has repeatedly tied that concern to a potential 100-year economic cycle around 2029 and 2030, roughly a century after the beginning of the Great Depression.
That is Gareth's macro framework, not a forecast the current charts have confirmed. The distinction is important.
His longer-term concern can be significant while the S&P remains bullish today. A trader does not have to choose between those two ideas. The chart determines when the longer-term thesis starts becoming relevant to current positioning.
Gold Is Losing the Near-Term Fight With Yields
Gold offers another example of fundamentals and price action pulling in opposite directions.
China's central bank added approximately 740,000 ounces of gold to its reserves in September, bringing holdings to 77.47 million ounces and extending its buying streak to 23 consecutive months.
That provides a longer-term fundamental tailwind for gold. It has not prevented near-term weakness.
A stronger dollar and elevated Treasury yields increase the opportunity cost of holding a non-yielding asset such as gold. Gareth is therefore letting the chart dictate his near-term view rather than assuming central-bank buying must immediately translate into higher prices.
His first major line in the sand is \$4,100.
"If it breaks \$4,100, we're likely headed to \$3,950, which is that previous low from June, July this year. And if we break \$3,950, \$3,500 is still that level."
The hierarchy is straightforward: \$4,100 is the immediate test, \$3,950 becomes the next major support if that level fails, and \$3,500 remains Gareth's deeper long-term accumulation zone for physical gold.
Silver is showing similar stress below \$60. Gareth is watching the current ascending trend line first, followed by approximately \$55 if that support fails.
Below that sits the much bigger \$50 level.
That area carries long-term significance because it represents the former ceiling around the major 1980 and 2011 highs. After silver finally broke through that multi-decade resistance, a future retest of the breakout zone would become technically important.
Oil Shows Why the Close Matters
Oil provided perhaps the cleanest example of Gareth's broader trading philosophy.
During Tuesday's session, crude appeared to be breaking major support. Traders who treated the intraday move as confirmation, however, were early. Oil recovered enough into the close to preserve the structure.
The key level now sits around \$88.75.
A confirmed daily close below that ascending trend line would materially weaken the chart and put the \$78 to \$79 area back in focus as the next downside objective.
Until then, support is still support.
That is the difference between anticipating a breakdown and trading one that has actually confirmed.
Bitcoin Still Has One Level That Matters Most
Bitcoin is facing the same test.
Despite today's weakness, Gareth still reads the broader structure as a bullish consolidation as long as Bitcoin holds above approximately \$81,000.
"As long as we hold 81, neutral to bullish bias has to be maintained on a probability factor. Regardless what I might think, I'm actually in the camp that I think we're due for a bigger pullback. But until the charts confirm it, it's just speculation on my part."
That may be the most important lesson from today's Game Plan.
Gareth personally believes Bitcoin could be due for a larger pullback. The chart has not given him confirmation.
A daily close below \$81,000 would change that read by invalidating the current bullish structure and putting the next major support around \$75,500 back in focus.
Until then, personal bias remains secondary to price.
Three Stock Levels on Gareth's Radar
The same framework produces several individual stock setups.
Palo Alto Networks (PANW) is approaching a major resistance zone around \$440 to \$445. Gareth derives that area from a parallel channel built from major pivot lows and projected through the upper boundary. A test of that zone would put a potential rejection setup on his radar.
Bank of America (BAC) is approaching a daily-chart gap near \$52.37. Rather than assuming the gap must produce a bounce, Gareth is watching the level as a potential reaction zone if price reaches it.
Micron (MU) is compressing between two trend lines, with approximately \$1,000 acting as the more important support. A confirmed daily close below that level would materially weaken the current structure and shift attention toward lower support.
These setups differ in direction, but the process is identical: identify the level first, then wait for price to confirm the reaction.
The Fed Minutes Are the Next Catalyst
The next macro test comes at 2:00 p.m. ET, when the Federal Reserve releases minutes from its September 15-16 meeting. The September meeting produced a 25-basis-point rate increase, and today's minutes could provide more detail on how policymakers are thinking about additional tightening.
With the 10-year yield already above 5.3%, any meaningful shift in the market's interpretation of the Fed could quickly feed back into bonds, the dollar and equities.
That makes yields the market's directional filter this afternoon.
The Bottom Line
The macro story looks increasingly uncomfortable. The charts are not yet confirming the worst-case interpretation.
That is the tension traders need to respect.
The S&P 500 is pulling back from record territory, but its larger structure remains intact. Gold and silver are weakening despite continued central-bank demand for gold. Oil threatened a breakdown but failed to confirm it. Bitcoin looks vulnerable, yet remains above the level Gareth needs to see break before shifting his technical bias.
The common thread is confirmation.
Rising yields may ultimately force a larger repricing across risk assets. Gareth's longer-term macro framework argues that the global debt problem will eventually become much harder for policymakers to contain. But neither argument is enough to override the chart today.
For now, the important numbers are the ones that can change the read: roughly 5.35% on the 10-year Treasury yield, \$4,100 on gold, \$88.75 on oil, \$81,000 on Bitcoin and the current bullish structure in the S&P 500.
The macro narrative tells traders where the pressure is building. Price tells them when it actually matters.
Trading involves substantial risk. All content is for educational purposes only and should not be considered financial advice or recommendations to buy or sell any asset. Read full terms of service.