Trading The Close Market Recap - 10/06/2026: Mega-Cap Rally Masks Breadth Divergence — 10-Year Yields & AI Energy Supercycle

S&P 500 Hits New Highs, but Market Breadth Is Flashing a Warning
The S&P 500 and Nasdaq are pushing into record territory, but Drew Dosek sees a very different market underneath the headline indices.
Roughly 70% of stocks in the major indices are trading below their 50-day moving averages, even as a concentrated group of mega-cap technology and semiconductor names continues to pull the cap-weighted averages higher. That divergence was the most important signal in Tuesday's Trading the Close.
It does not mean the rally has to end tomorrow. In fact, Drew's technical targets suggest the major indices can still push higher. But it does mean traders should separate price strength in the indices from strength in the market itself.
And the 10-year Treasury yield may ultimately decide which one wins.
S&P 500 and Nasdaq Rally as Market Breadth Weakens
New all-time highs normally suggest broad risk appetite. This market is telling a different story.
About 70% of stocks within the major indices are currently below their 50-day moving averages. That means much of the market is struggling even as the S&P 500 and Nasdaq continue higher.
The reason is concentration. Mega-cap technology and semiconductor stocks have enough weight to push the indices upward while weakness spreads underneath them.
Drew highlighted just how unusual that setup has become.
"The rareness as I'm talking about with the breadth of the market has only occurred three times guys, it's only occurred three times. The dot-com bubble in 2021 and in 2024."
The takeaway is not that history has to repeat exactly. It is that this degree of divergence deserves attention because the index price alone is giving traders an incomplete picture.
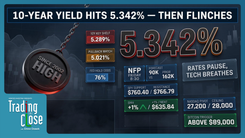
The 10-year Treasury yield, currently around 5.289%, helps explain the split. Higher yields raise the cost of capital and tend to hit smaller and more debt-dependent companies harder than cash-rich mega-caps.
That creates the market's central tension: the stocks carrying the indices can keep carrying them for a while, but the higher yields remain, the harder it becomes for the rest of the market to participate.
S&P 500 Technical Setup Still Points Higher
Weak breadth is a warning. It is not, by itself, a sell signal.
That distinction matters in Drew's current S&P 500 setup. The index has triggered a large inverse head and shoulders pattern with a measured move target near 800.92.
The important level underneath the move is 775.18, the neckline of the pattern. As long as the S&P 500 holds that area on a closing basis, the bullish setup remains intact.
A daily close below 775.18 changes the picture. That would invalidate the breakout and remove the 800.92 measured move target.
The Nasdaq is showing a similar setup, although its inverse head and shoulders pattern is less clean. Its technical target sits just above 28,000, leaving roughly another 500 points of potential upside from current levels.
That is why Drew is not fighting the rally simply because the internals look weak. The divergence raises risk, but price still has to confirm the reversal.
Semiconductor Strength Is Keeping the Rally Alive
Semiconductors remain one of the clearest explanations for why the indices have been able to ignore weak breadth.
The VanEck Semiconductor ETF (SMH) confirmed a breakout on September 18 and later reached its 61.8% Fibonacci retracement at $607.58, measured from the prior high to the July 29 low.
SMH is now working through the 78.6% retracement, with its all-time high around $672 still above.
That puts the semiconductor sector within striking distance of another breakout and makes it an important confirmation signal for the broader tech rally.
But here again, yields matter. A retreat in the 10-year could give technology room to continue toward Drew's upside targets. Continued pressure higher in yields would make the market increasingly dependent on a narrowing group of leaders.
That is not necessarily where the rally ends, but it is where the margin for error gets smaller.
AI Power Demand Creates a Second Major Market Theme
While breadth and yields define the near-term index setup, another theme is developing on a much longer timeline: the amount of electricity required to support AI infrastructure.
Constellation Energy (CEG) announced a $4.3 billion agreement with Google, while Vistra (VST) received a conditional $4.2 billion Department of Energy loan. For Drew, those developments fit a larger structural story.
AI data centers are only part of the demand equation.
"AI data centers aren't going to be the only things causing a big drain on the power supply here in the United States. It's going to be all these new gadgets that come along with it too."
Robotics and other AI-driven technologies could add another layer of electricity demand on top of data-center expansion. At the same time, building generation capacity and upgrading the grid can take years.
That mismatch between rapidly growing demand and slower-moving supply is why power and nuclear names remain important charts to watch.
Constellation Energy, Vistra and Cameco Levels to Watch
Constellation Energy closed near $300.41, the neckline of a large inverse head and shoulders pattern. A confirmed daily close above that level would trigger the pattern, with a measured move target near $391.
Before that target comes into play, Drew is watching resistance around $327, followed by roughly $345 at the midpoint of the stock's rising parallel channel.
Vistra surged 10.77% Tuesday and is approaching a declining neckline dating back to January. The breakout area sits around $164.20 to $164.32.
The size of Tuesday's move makes confirmation especially important. Rather than chasing an extended stock, Drew's preferred setup would be a confirmed breakout followed by a successful retest of the trend line.
Cameco (CCJ) presents the other side of the energy trade. The stock rallied 6.35%, but its weekly chart still contains a potentially bearish head and shoulders pattern.
The key neckline sits at $85.61. A confirmed breakdown would put the bottom of its broader parallel channel near $40.47 into play. Bulls need CCJ above declining resistance around $102.99 to weaken that bearish structure and reopen a path toward $118.
The three charts tell the same broader story in different ways: the fundamental power-demand thesis may be strong, but the entry still comes from price.
Oil Holds $86.86 Support as Natural Gas Tests a Breakout
Oil provided one of Tuesday's cleaner examples of why waiting for a technical level matters.
Drew had been watching $86.86 as support. Price briefly moved four cents through that level before reversing sharply higher.
The larger chart remains constructive. Oil is trading within a parallel channel while an inverse head and shoulders pattern points toward approximately $116.51, with nearby resistance around $116.42.
The reaction at $86.86 reinforces the level, but the more important lesson is how price behaved there. Traders who anticipated support had a defined area to judge the trade rather than chasing the reversal after it was already underway.
Natural gas is approaching a similar decision point at $3.22. A confirmed daily close above its declining trend line would trigger a breakout setup with Drew watching approximately $3.60 next.
The word confirmed matters.
An intraday move through a trend line is not enough. Drew wants the closing candle to prove that price can hold beyond the level before treating it as a legitimate break.
Gold and Silver Remain Under Technical Pressure
Precious metals have not yet produced the same constructive setup.
Gold continues to consolidate with a bearish tilt. Drew is watching $4,104 as near-term support. If that fails, the next significant level comes in around $3,947.
Silver also remains vulnerable. Its current structure includes a bear flag, with the downside measured move pointing toward approximately $53.26.
Neither chart requires traders to predict the next move. The levels define when the existing setup remains valid and when the market begins telling a different story.
Bitcoin Faces a Major Weekly Decision at $89,400
Bitcoin may be approaching one of its more important technical tests of the year.
On the weekly chart, BTC is sitting near the lower boundary of a large parallel channel. Losing that support would materially weaken the structure and could open substantially lower levels, including the $50,000s and potentially below $40,000.
The bullish trigger is much clearer: $89,400.
A confirmed break above $89,400 would give bulls a significant technical green light and shift attention toward the channel's 50% midpoint above $100,000.
Until one side confirms, Bitcoin is sitting at a decision point rather than presenting a completed trade.
Why Confirmation Matters More in a Narrow Market
That same principle connects nearly every chart Drew discussed Tuesday.
When market breadth is weak, yields are elevated and individual stocks are making large moves, anticipating a breakout becomes more dangerous. Price can briefly cross a technical level and reverse before the close.
As Drew explained while discussing natural gas:
"I know my thing with TA. That's not gonna get me out because price can whip right back over that line the next day."
Seagate (STX) is a good example. The stock fell 9.18% and closed below an inclining parallel channel that had supported price since March.
The next major support area sits near $748.21, where a gap fill and 50% Fibonacci retracement converge. If buyers defend that area, STX could eventually retest the broken channel near $834.75.
But the setup is at $748.21, not simply "after a 9% decline."
That is the difference between reacting to price and waiting for price to reach an area where risk can actually be defined.
What Traders Should Watch Next
Tuesday's new highs do not tell the entire story.
The S&P 500 and Nasdaq still have bullish technical structures and identifiable upside targets. Semiconductors remain strong enough to keep supporting those moves. But underneath the indices, roughly 70% of stocks trading below their 50-day moving averages shows how narrow the advance has become. Pasted markdown
That puts three signals at the top of the board heading into the next session: market breadth, the 10-year Treasury yield and confirmation at the major index levels.
If yields ease and participation begins to broaden, the S&P 500's path toward 800.92 becomes easier to sustain. If yields keep climbing while breadth deteriorates further, the mega-cap leaders will have to do even more work to keep the indices elevated.
For now, Drew's framework is not to predict which outcome has to happen. It is to know the levels that tell you when it is happening.
That is especially important in a market where the index can look strong while most of the stocks underneath it are saying something else.
Options Edge
For traders looking to apply defined-risk options strategies around technical setups, Verified Investing recently launched Options Edge with Jake Sweeney, Gareth Soloway and Drew Dosek.
The service uses calls, puts and multi-leg strategies to structure trades around specific market setups while defining risk before entering the position.
Trading involves substantial risk. All content is for educational purposes only and should not be considered financial advice or recommendations to buy or sell any asset. Read full terms of service.