Trading The Close Market Recap - 10/05/2026: Head-and-Shoulders Sweep Fuels S&P 500 & NASDAQ Breakouts — Oil, Gold, Bitcoin in Focus

Breakouts Are Holding. Now Traders Need to Let Price Come Back to Them
The NASDAQ pushed to another all-time high Monday, while the S&P 500 extended Friday’s breakout above a declining trend line. The headline is straightforward: stocks are moving higher.
The more useful signal is how those breakouts are behaving.
Across several of the charts Pro Trader Drew Dosek covered during Monday’s Trading the Close, price is either confirming a breakout, building a recognizable continuation pattern, or approaching the retest that often follows the initial move. That creates opportunity, but it also creates one of the easiest mistakes for traders to make: chasing price after the move has already become obvious.
Drew’s framework into the close was much simpler. Let the breakout prove itself, identify the level that should become support, then see whether price gives you the retrace.
S&P 500 and Nasdaq Breakouts Hold Above Key Technical Levels
The S&P 500 gained 0.67% Monday and, more importantly, continued to hold above the declining trend line that had contained price over the previous several sessions.
Friday delivered the initial breakout. Monday provided another close above the line.
That matters because one candle through resistance can be noise. Consecutive closes begin to establish something more meaningful: former resistance has a chance to become support.
Thursday may have provided an early clue. The S&P sold lower before reversing sharply and leaving behind a large lower wick. Drew noted that it resembled a bottoming tail, even though it did not form at the textbook location traders would normally expect.
“That looks like a bottoming tail, and it is acting like one for at least the following two trading days, pushing price up,” Drew said.
The lesson is not to force a candlestick label onto the chart. It is to watch how price behaves afterward. Buyers defended the weakness, and the next two sessions validated that defense.
Now the S&P is developing a potential inverse head and shoulders pattern. A close through the neckline would trigger the setup and produce a measured move toward 800.92. If the market pulls back first, the more important test comes around the former declining trend line near 765.42.
That is where the breakout becomes more useful to a trader. A controlled retrace into former resistance would test whether buyers are actually willing to defend the move.
The NASDAQ is already further along. It pushed to new all-time highs Monday and has extended farther away from its breakout area rather than immediately retesting it. On the weekly chart, Drew identified the 28,000 to 28,200 area as the next major resistance zone.
The trend remains bullish, but the farther price stretches from support, the less attractive the entry becomes.
10-Year Treasury Yields and the U.S. Dollar Remain Firm
There is another important piece of Monday’s market structure: Treasury yields remain elevated.
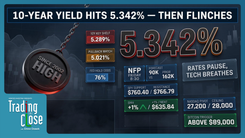
The 10-year Treasury yield pushed to a new high for the year before backing off. Normally, persistent strength in yields would deserve attention as a potential headwind for equities. Yet stocks continue to hold their bid.
Drew connected some of that resilience to instability overseas, particularly in Europe. His argument is that uncertainty abroad can attract capital toward the relative liquidity and perceived safety of U.S. assets.
That creates an unusual combination. Yields can remain elevated, the U.S. dollar can stay firm, and U.S. equities can still attract capital.
For traders, the important point is not that higher yields suddenly do not matter. It is that price is telling us they are not currently enough to break the equity trend.
That relationship deserves attention if it changes. If yields continue higher while equities begin failing breakout levels, the market would be sending a very different message.
For now, it has not.
Gold, Silver and Oil Test Key Support and Resistance Levels
The same pattern-recognition theme appears across commodities, but not every setup is equally bullish.
Gold remains inside a bear flag while also developing the broader shape of a possible inverse head and shoulders pattern. That makes the neckline critical. Bulls still need a breakout through the declining neckline before the larger bullish structure becomes actionable. A failure of the developing right shoulder below the head would instead invalidate the setup.
Support just below \$4,000 remains an area Drew is watching for long-term bulls seeking a better entry.
Silver is more vulnerable. It has already broken a smaller head and shoulders pattern to the downside, putting the 50% level of its parallel channel near $58.92intofocus.Ifthelargerbearishstructurefollowsthrough,Drew’smeasuredmovepointstowardthelow-$55 area.
The distinction between the two metals is useful. A pattern taking shape is not the same thing as a pattern triggering. Until price confirms the neckline break, traders have a possibility, not a trade.
Oil reinforces the same lesson.
U.S. Oil fell 2.24% Monday as a large bear flag continued to develop. A broader inverse head and shoulders structure still carries an upside target near \$116, but the immediate chart favors watching support around \$86.90 first. If buyers defend that area, a move back toward \$108 becomes more credible.
Natural gas is showing the opposite behavior. After briefly closing below support last Thursday, sellers failed to generate follow-through. Price instead reclaimed the trend line and bounced sharply. The next test is declining resistance around \$3.23 to \$3.24.
A breakdown without follow-through is information. So is a breakout without follow-through. Drew’s approach is to make price prove which side actually has control.
Bitcoin Faces a Bullish Short-Term Setup and Bearish Macro Pattern
Bitcoin may be the cleanest example of why timeframe matters.
In the near term, Bitcoin is consolidating around \$86,500 in what Drew sees as a potential cup-and-handle structure. Sideways action after an advance can be constructive because it allows an extended move to digest without immediately giving back the breakout.
Zoom out, however, and the picture becomes considerably less comfortable.
A much larger head and shoulders structure remains visible on the chart, with a bearish measured move toward \$37,000 if the pattern ultimately triggers. Drew identified \$89,543 as an important level for bulls to reclaim if they want to begin neutralizing that larger bearish setup.
That leaves Bitcoin caught between a constructive short-term consolidation and a potentially dangerous macro structure.
Political uncertainty adds another variable as traders look toward November’s midterm elections and the future of U.S. crypto regulation. But the chart still provides the decision points. Rather than guessing which catalyst wins, traders can watch whether Bitcoin can reclaim resistance or begins confirming the larger bearish structure.
General Mills Nears Its Head and Shoulders Price Target
Individual stocks provided some of Monday’s clearest examples of Drew’s broader lesson.
General Mills (GIS) is approaching the conclusion of a head and shoulders setup Drew has tracked since 2024. The original measured move projected \$30.26, a target that once appeared distant. With GIS now around \$31.68, price has nearly completed the move.
More important than the accuracy of the target is how price got there. GIS broke its neckline, retested it, failed to reclaim it, and continued lower. That sequence is exactly why Drew places so much emphasis on the retest after a technical break.
Now the setup is changing. GIS is approaching a significant support zone around \$30.70 to \$30.90, reinforced by an 88.6% Fibonacci retracement and historical pivots. After such a vertical decline, Drew sees room for a technical bounce toward \$35.54 if buyers begin defending that support.
The same logic works in the opposite direction on bullish breakouts.
One of Monday’s strongest individual-stock setups broke through overhead resistance after holding an inclining trend line last week. The chart now carries an inverse head and shoulders structure with a measured target near \$217, but Drew does not want traders chasing an extended move.
Instead, he is watching the 61.8% retracement near \$179.49.
“It likes to retrace back down to the neckline and then bounce, our signature breakout retrace bounce play,” Drew said.
That is the setup worth remembering from Monday’s show.
The initial breakout attracts attention. The retrace often creates the trade.
Western Digital Stock Reaches a Critical Technical Inflection Point
Western Digital (WDC) offers a slightly different setup because neither side has established control yet.
After last week’s sharp decline briefly broke a long-term inclining trend line, WDC gapped higher Monday and reclaimed that support. But price remains underneath declining resistance extending from July.
That leaves WDC compressed between support and resistance.
Drew identified \$550.63 as the upside target if price can break through the declining trend line. A failure back below support near \$427.41 would instead put the bullish recovery in serious trouble.
There is no reason to predict which side wins while price remains trapped inside the structure. The edge comes from waiting for confirmation.
Key Market Levels for Traders
Monday’s new highs are bullish, but the better lesson is not simply that stocks went up.
Breakouts across the market are beginning to hold, and multiple assets are developing recognizable technical structures around those moves. That gives traders clearly defined levels for confirmation, support and invalidation.
It also makes patience more important.
When price breaks through a major neckline or trend line, chasing the first extension usually means accepting worse risk-reward precisely when FOMO is highest. Drew’s breakout-retrace-bounce framework turns that impulse around: let price break, let the market prove the level matters, then watch whether former resistance becomes support.
The S&P 500’s 765.42 area, the NASDAQ’s extension toward 28,000 to 28,200, Bitcoin’s \$89,543 resistance and WDC’s tightening apex all give traders concrete levels to watch next.
Trading involves substantial risk. All content is for educational purposes only and should not be considered financial advice or recommendations to buy or sell any asset. Read full terms of service.