My Trading Game Plan Revealed - 12/22/2025: Holiday Float Hits S&P Ceiling, Oil Poised to Lead 2026

As the year draws to a close, markets are entering a unique and often misunderstood period. With institutional players stepping away for the holidays, the trading landscape shifts, creating a dynamic driven by retail sentiment. In this morning's My Trading Game Plan, Gareth Soloway, Chief Market Strategist at Verified Investing, broke down the mechanics of this "holiday float," identified the technical ceilings for major indices, and revealed his surprising pick for the best-performing asset of 2026.
This article delves deeper into these critical themes, providing expanded context on the technical patterns, global economic signals, and strategic opportunities that traders should be monitoring as we head into the new year.
The Holiday Float: A Retail-Driven Market with a Ceiling
The final two weeks of the year are characterized by what is known as the holiday float—a period of significantly lighter trading volume. As Gareth explained, this is a direct result of the big institutional money taking an extended break.
"The institutional money takes the whole entire two weeks off… that leads retail, retail investors to rule the roost. Now that means retail because naturally retail buys more than they short… That means the bias to the market remains neutral to higher for this week and next week."
This retail dominance creates an upward bias, as individual investors are predominantly long-oriented. However, this doesn't signal a free-for-all rally. Technical analysis provides a crucial roadmap, and for the S&P 500, that map points to a very clear and defined ceiling. A weekly chart of the S&P 500 reveals a massive parallel channel that has dictated major market tops and bottoms. The index is currently pressing against the upper bound of this channel, a level that has historically triggered significant corrections.
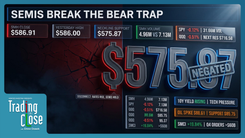
Based on this data, the potential upside is mathematically limited. From current levels, the S&P 500 has approximately 2.2% of room to run before hitting this formidable resistance. The Nasdaq 100 has a bit more, with about 3.4% of potential upside. While the holiday float can keep markets buoyant, traders must respect the powerful technical barriers that lie just ahead.
An Echo of 2021: Is History Repeating?
For seasoned chart technicians, patterns often rhyme. The current price action at the top of the S&P 500's parallel channel bears a striking resemblance to the market top in 2021. Gareth highlighted this fascinating historical parallel as a data-driven possibility for what may unfold.
"If we go back here in the highs of the bull market of 2021, look at what happened here. We came up, we tagged it, we pulled back, we double tagged it, and then we sold off… If we float up into year end, do we tag that again and hit all-time highs? Because then the mainstream media will go nuts that it's at all-time highs. And then does that start to cascade lower?"
This potential sequence—a push to tag the trendline, a minor pullback, and a final float higher into year-end to make a new all-time high—is a classic pattern of distribution. It allows bullish enthusiasm to reach a fever pitch just as the underlying technical strength is waning. Should this pattern play out, it sets the stage for a significant reversal in early 2026, precisely when institutional volume is expected to return to the market. This is a critical reminder that market analysis is not about hope or emotion; it's about recognizing patterns and probabilities based on historical data.
The Global Yield Warning Shot
While US markets float higher, a critical signal is flashing from overseas. The Japanese 10-year yield surged again overnight, hitting 2.1% before settling around 2.084%. For many US-centric investors, this may seem like a distant concern, but its implications are global and profound.
A rising Japanese yield puts pressure on the "yen carry trade," a popular strategy where investors borrow yen at low-interest rates to invest in higher-yielding assets elsewhere, including US stocks and bonds. As Japanese rates rise, this trade becomes less profitable and riskier, potentially leading to an unwinding that can "suck major liquidity out of the U.S."
Furthermore, rising yields in a major economy like Japan can create a ripple effect across global bond markets. If investors start demanding higher rates to hold Japanese debt, they may soon demand the same for US debt, especially given concerns about fiscal responsibility. Remember, while the Federal Reserve controls short-term rates, the market dictates long-term rates like the 10-year Treasury. A breakout in the US 10-year yield, even after recent Fed cuts, would be a major headwind for stocks, the housing market, and the broader economy.
Key Levels in Tech and Commodities
Amid the broader market trends, specific stocks and commodities are approaching pivotal levels that could offer high-probability trading opportunities.
- Micron (MU): This semiconductor stock is approaching a significant technical resistance zone between $280 USD and $281 USD. This area represents a confluence of a broken trendline and prior price pivots, making it a prime candidate for both a day trade and a swing trade to the short side.
- Broadcom (AVGO): After a successful bounce off support, Broadcom's rally is likely a short-term affair. The major level to watch for a longer-term downside target is a large gap fill located around $305 USD to $306 USD.
- Palantir (PLTR): Palantir is currently trading directly into resistance at the $195 USD level. A decisive break above this could send it to the next major target: a gap fill at $207 USD. That level would also constitute a double top, creating a powerful two-factor setup for a potential short trade.
- Silver (XAG/USD): The run in silver has been nothing short of spectacular, surging 52% in just two months. However, it is now hitting the top of a parallel channel, a technical sign of an overbought condition. While the long-term trend remains bullish, this level suggests a pullback is imminent. Gareth noted taking a short-term short position to capitalize on this expected correction.
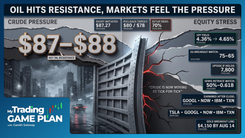
The Contrarian Call for 2026: Why Oil?
When asked about the best-performing asset for the coming year, Gareth offered a bold, contrarian view: crude oil. While assets like gold and silver are making all-time highs, oil has been a significant laggard. This underperformance is precisely what makes it so compelling.
"If you would do inflation adjusted on oil, it's trading at like forty dollars a barrel. I mean, it is massively lower… there's a thing that institutions do. They don't like to take money out of the market… where can we reposition that money where it's cheaper, where it hasn't made a move? And to me, that's oil."
This is the essence of a "catch-up trade." Institutions, hesitant to move to cash, often rotate capital from assets they deem expensive into those that are undervalued. When measured against inflation, or even other commodities like gold and silver, oil is trading at rock-bottom prices.
The technical chart of Occidental Petroleum (OXY), a major Warren Buffett holding, provides powerful confirmation of this thesis. OXY is carving out a massive inverse head and shoulders pattern with a neckline that extends back to 2014. A breakout from this decade-long pattern would signal a monster move to the upside, reflecting a potential sea change in sentiment toward the energy sector.
The January Crossroads: Snapback vs. Sell-Off
January presents two conflicting narratives that traders must prepare for. The first is the "January Effect," a well-known phenomenon where stocks that were poor performers in the previous year experience a sharp rally. This is driven by the cessation of tax-loss selling, which artificially depresses these names into the end of December. Gareth is actively compiling his list of potential January Effect long trades.
However, a more ominous possibility looms. The return of institutional money in the second week of January could bring a wave of selling. The light-volume holiday rally provides the perfect cover for large funds to unload positions into unsuspecting retail buyers. They can use the retail-driven float as "exit liquidity" before repositioning for the year ahead. This sets up a potential clash of forces in early 2026 that could determine the market's direction for the first quarter.
Conclusion: Navigating with a Probabilistic Edge
The current market environment is a textbook example of why technical analysis is indispensable. While the holiday narrative suggests a simple upward drift, the charts provide a much more nuanced picture: a market with a near-term bullish bias but a clearly defined technical ceiling.
Looking ahead, the potential for a major rotation into undervalued assets like oil, the conflicting forces of the January Effect and the return of institutional sellers, and the ever-present influence of global bond yields create a complex but navigable landscape.
As Gareth concluded, trading is ultimately a game of probabilities. "It's a probability game. And to know that the odds are in our favor when we read the charts properly is really cool." By focusing on data-driven analysis, respecting key technical levels, and understanding the larger market dynamics at play, traders can position themselves to capitalize on the opportunities ahead, no matter which direction the market breaks.
Trading involves substantial risk. All content is for educational purposes only and should not be considered financial advice or recommendations to buy or sell any asset. Read full terms of service.