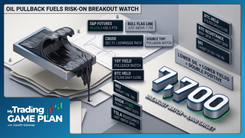
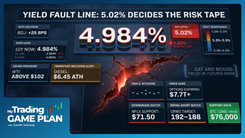
Trading The Close Market Recap - 09/22/2026: Tech Roars Toward NASDAQ 28,000 While Financials Falter and Commodities Test Key Levels

Tech Is Leading, but the Rest of the Market Is Not Following
Monday's tech surge looked like a broad risk-on move. Tuesday exposed something more useful.
The Nasdaq pushed to another record while the S&P 500 largely consolidated and major banks came under pressure. Semiconductors extended their breakout sequence, but several are now approaching meaningful resistance. Oil continued lower. Bitcoin is testing a level that could determine whether its larger bearish pattern survives.
That divergence is the real setup heading into the rest of the week.
For Drew Dosek, the question is no longer whether technology has momentum. It clearly does. The more important question is how much of that strength can survive the resistance now coming into view, especially if financials and other economically sensitive areas continue moving the other way.
The Nasdaq Is Leading, but 28,000 Is the Test
Monday established the backdrop. The Nasdaq Composite jumped 2.26% to a record closing 27,122.09 as AI and semiconductor names drove the advance. Falling oil and Treasury yields also helped improve the broader risk environment.
Tuesday extended that strength. The Nasdaq reached another intraday record above 27,200 while the S&P 500 traded much closer to flat.
That tells Drew something about leadership. Technology is not simply participating in the market. It is doing much of the pulling.
But the chart is also beginning to define where that strength could be tested.
Drew is watching the 28,000 area on the Nasdaq Composite because two forms of resistance converge there. The first is psychological: 28,000 is a major round number. The second is structural: a long-term trend line connecting the November 2021 and December 2024 pivots approaches the same area.
That is what makes 28,000 more important than the number alone.
“X marks the spot, double layer of resistance. If we continue in this fashion, this would be a very hard level to get through on the first attempt.”
A first rejection would not automatically damage the larger bullish structure. It would simply tell traders that momentum has reached a place where sellers have a reason to respond.
Semiconductors Confirm the Leadership, but SMH Is Getting Extended
The VanEck Semiconductor ETF is giving Drew the cleanest confirmation of the Nasdaq's strength.
SMH has produced three bullish technical developments in four sessions: a break above its longer-term declining trend line, a reclaim of the daily 50-day moving average, and now a breakout above the top of its rising parallel channel.
Three separate signals pointing in the same direction strengthen the bullish read.
The problem is location.
SMH has now pushed into approximately $607.58, which Drew identifies as the 61.8% Fibonacci retracement of the recent decline. RSI is also approaching the 70 area.
That changes the risk-reward of chasing the move.
The bullish thesis does not require SMH to keep accelerating vertically. In fact, a pullback toward the recently broken channel could be more informative. If former resistance begins acting as support, the breakout gains credibility. If price falls straight back inside the channel, the latest breakout becomes less convincing.
That is the decision point.
Banks Are Sending a Different Message
Technology's strength becomes more interesting when compared with financials.
JPMorgan fell roughly 3.4% Tuesday as bank stocks came under pressure. Drew is watching $343.15 as the first major support area on JPM, where a cluster of weekly wicks has previously attracted buyers.
A weekly close below that zone would weaken the structure and bring the rising trend line from the April 2025 low, near $325.14, into focus. Below that, Drew has the median line of the longer-term parallel channel near $320.75.
Wells Fargo and Bank of America are showing similar deterioration, with Drew watching Fibonacci support near $80.12 on WFC and $55.38 on BAC.
The important signal is the divergence itself.
The Nasdaq can keep making highs while banks weaken. But if financials continue losing support while the market's gains become increasingly concentrated in technology, traders should recognize that the headline index strength is masking a less uniform tape underneath.
That does not invalidate the tech rally. It changes how much confirmation the rally is receiving from the rest of the market.
Oil's Decline Is Helping, but Its Bigger Pattern Is Still Alive
Oil is another piece of the cross-asset picture.
Crude continued lower Tuesday as hopes for improved Middle East supply conditions reduced some of the geopolitical premium that had built into prices. Reuters reported that Iran had signaled it could reopen the Strait of Hormuz under certain conditions, while Saudi Arabia was also moving to restore pipeline capacity.
Technically, Drew still sees downside room toward the lower boundary of oil's parallel channel around $86.38.
But that is only the near-term structure.
On the larger chart, oil is developing what Drew reads as an inverse head-and-shoulders pattern beneath a declining neckline. That pattern has not triggered. If price eventually breaks and confirms above the neckline, Drew's measured-move projection points toward approximately $116.27.
Until then, the distinction is important: the bullish pattern is developing, while the shorter-term price action remains under pressure.
Gold and Silver Are Holding Their Structures
Precious metals are giving a different signal.
Gold remains inside Drew's rising parallel channel after recovering sharply from its prior decline. The chart has transitioned from the V-shaped recovery into consolidation, with $4,575 representing the next major resistance area on Drew's chart.
Silver is more complicated.
Its previous bearish head-and-shoulders setup failed to follow through, and Drew is now tracking a developing inverse head-and-shoulders structure instead. Resistance near $67.99 remains the immediate test. A confirmed breakout would strengthen the reversal case and put the larger measured-move projection near $72.07 into focus.
Until that happens, it remains a setup rather than a confirmed move.
That distinction between a pattern forming and a pattern triggering is one of the most important habits in technical analysis.
Natural Gas Shows What a Breakout Retest Can Look Like
Natural gas provides the clearest example of the sequence Drew wants to see elsewhere.
After bottoming in August, price formed a V-shaped recovery, consolidated, broke resistance, returned to test the breakout area and then bounced.
Breakout, retest, response.
That sequence matters because the retest gives traders additional information. Price is no longer simply moving above resistance. The market has returned to the same level and shown that buyers are willing to defend it from the other side.
Drew's next major technical reference sits near $3.24, where a declining trend line comes into play.
A break above that trend line would further strengthen the case that natural gas is working its way back toward the larger parallel channel that has defined the macro structure since 2024.
Bitcoin Has a Simple Line in the Sand
Bitcoin may have the cleanest binary level in the entire group.
After Monday's surge, Bitcoin is testing the neckline of the larger head-and-shoulders pattern around $89,154. That level previously acted as support before price broke underneath it.
Now it is resistance.
At the same time, the shorter-term chart has formed what Drew reads as a bull flag. That creates two competing structures: bearish resistance on the higher timeframe and bullish consolidation underneath it.
The resolution matters more than either pattern by itself.
A daily close above $89,154 would materially weaken the bearish head-and-shoulders thesis and shift attention back toward the prior highs. Failure to reclaim it keeps the larger bearish structure intact.
That is why the close matters more than an intraday wick through the level.
The Bigger Lesson Is Confirmation
Drew's charts look different, but they are all asking a version of the same question.
What happens when price reaches the level where the thesis is supposed to prove itself?
SMH has already broken out, but now needs to show that former resistance can hold as support. The Nasdaq has momentum, but 28,000 brings a new layer of resistance. Bitcoin is pressing directly into broken support. Oil has a bullish reversal structure that still needs a neckline breakout. Financials are moving in the opposite direction and testing support instead.
Those levels matter because charts are ultimately records of positioning and behavior.
As Drew put it:
“We're emotional roller coasters as humans, aren't we? We're hot on something, then we're cold on that. Guys, we are emotional beings, and thus, that's what happens in the charts.”
Support and resistance are not powerful because a line exists on a screen. They matter because traders remember where they bought, sold, missed a move or got trapped. When price returns to those areas, that positioning gets tested again.
That is also why Drew places so much weight on closing prices.
An intraday breakout shows that price crossed a level. A close can provide stronger evidence that the market was able to hold it.
Bottom Line
Technology still has control of the tape, but Tuesday made the internal divergence harder to ignore.
The Nasdaq and semiconductors remain the leadership group. Financials are weakening. Oil is falling while preserving a larger potential reversal structure. Bitcoin is testing former support from underneath.
The next signal is not whether these markets move another one or two percent. It is how they behave when they reach the levels that are supposed to matter.
For the Nasdaq, that means watching the path toward 28,000. For SMH, it means whether the breakout survives a retest. For JPM and the banks, it means whether current support gives way. For Bitcoin, $89,154 remains the line in the sand.
The charts have already mapped the decision points. Now price has to answer them.
Trading involves substantial risk. All content is for educational purposes only and should not be considered financial advice or recommendations to buy or sell any asset. Read full terms of service.