Non Farm Payrolls: An In-Depth Look

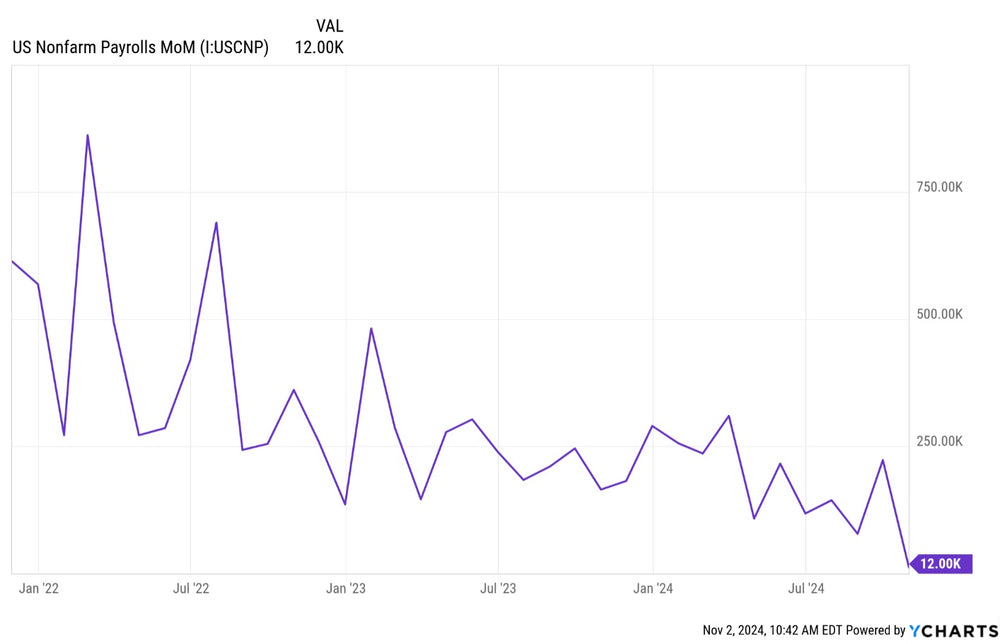
The latest Non Farm Payrolls Report showed a sharp decline in hiring. However, the analyst and economist spin was that it was largely because of two hurricanes that hit Florida and the Boeing (BA) strike. Whether true or not, we will not know until next month's number.
Let's Explore The Non Farm Payrolls And How It Is calculated
The non-farm payrolls (NFP) report is a key economic indicator for the United States that measures the change in the number of people employed during the previous month, excluding those working in the farming industry.
Here's why it's important and how it's calculated:
Importance of the NFP Report
- Economic Health: The NFP report provides valuable insights into the overall health of the U.S. economy. Job growth is often seen as a sign of a strong economy, while job losses can indicate economic weakness.
- Consumer Spending: Job creation is a leading indicator of consumer spending, which accounts for a significant portion of economic activity. More jobs generally lead to increased consumer confidence and spending, further fueling economic growth.
- Impact on Markets: The NFP report has a significant impact on financial markets, including the U.S. dollar, bond market, and stock market. A higher-than-expected NFP number is generally seen as positive for the USD and stocks, while a lower-than-expected number can have the opposite effect.
- Policy Decisions: The Federal Reserve considers the NFP report when making monetary policy decisions. Strong job growth may influence the Fed to raise interest rates to combat inflation, while weak job growth may lead to a more accommodative monetary policy.
How the NFP Report is Calculated
The NFP report is based on two surveys conducted by the U.S. Bureau of Labor Statistics (BLS).
-
Establishment Survey: This survey gathers data from approximately 147,000 businesses and government agencies, representing around 676,000 individual worksites. It covers about 80% of total non-farm employment. The survey collects information on:
- Total employment
- Hours worked
- Earnings
-
Household Survey: This survey involves interviews with around 60,000 households. It's used to estimate the unemployment rate and provides information on:
- Labor force participation rate
- Employment status by demographic characteristics
Calculation:
The BLS uses the establishment survey data to calculate the change in non-farm payrolls from the previous month. The survey results are seasonally adjusted to account for predictable variations in employment patterns throughout the year.
Release Date:
The NFP report is typically released on the first Friday of every month at 8:30 AM Eastern Time.
**Key Data Points in the NFP Report
- Net Change in Non-Farm Payrolls: This is the headline number that everyone focuses on. It represents the total number of jobs added or lost in the previous month.
- Unemployment Rate: Calculated from the household survey, it represents the percentage of the labor force that is unemployed and actively seeking employment.
- Average Hourly Earnings: This measures the average hourly wage for all employees on private non-farm payrolls. It's an important indicator of wage inflation.
- Average Workweek: This shows the average number of hours worked per week by all employees on private non-farm payrolls.
Trading involves substantial risk. All content is for educational purposes only and should not be considered financial advice or recommendations to buy or sell any asset. Read full terms of service.


