Ethereum Update: Here Is The Chart Analysis
Ethereum saw minor upside in the last week, gaining approximately 3.5%. The cryptocurrency continues to lag Bitcoin and many other altcoins. With the stock market making new all-time highs, Ethereum continues to be one of the last choices for risk-on investors.
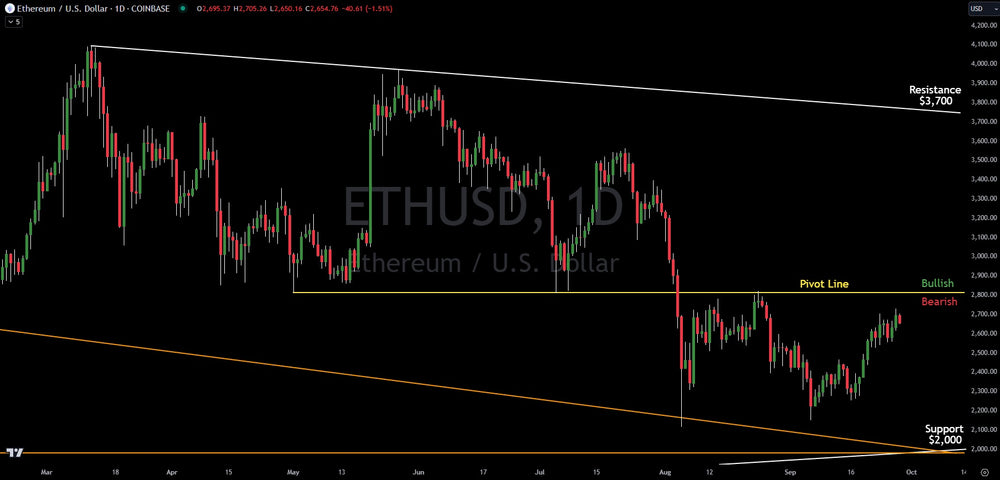
From a technical analysis perspective, Ethereum remains below its bullish/bearish pivot line. The pivot line sits at $2,800. As long as the price of Ethereum remains below that line, the bias based on chart analysis is negative. Should Ethereum recapture that line, a bullish bias would take over.
Should Ethereum begin to flush lower, the major technical support is $2,000 or just below. The level has multiple trend line levels coexisting together and means it will be a big buying level for investors and a likely major bounce level.
If Ethereum rallies and confirms above $2,800, the bias flips to bullish. This means pullbacks are buying opportunities. There is no major resistance until $3,700.
Overall, most technical investors are waiting patiently for a flush to $2,000 or just below to accumulate. However, should Ethereum establish itself above $2,800 and form a bull flag, technical traders would begin to accumulate for a run higher.
Verified Investing gives investors pure data and technical analysis. This allows investors to make decisions based purely off data rather than narratives and hype. Verified Investing fights for the retail investor.
Trading involves substantial risk. All content is for educational purposes only and should not be considered financial advice or recommendations to buy or sell any asset. Read full terms of service.