Technical Analysis: Bitcoin Price Action Update For Investors

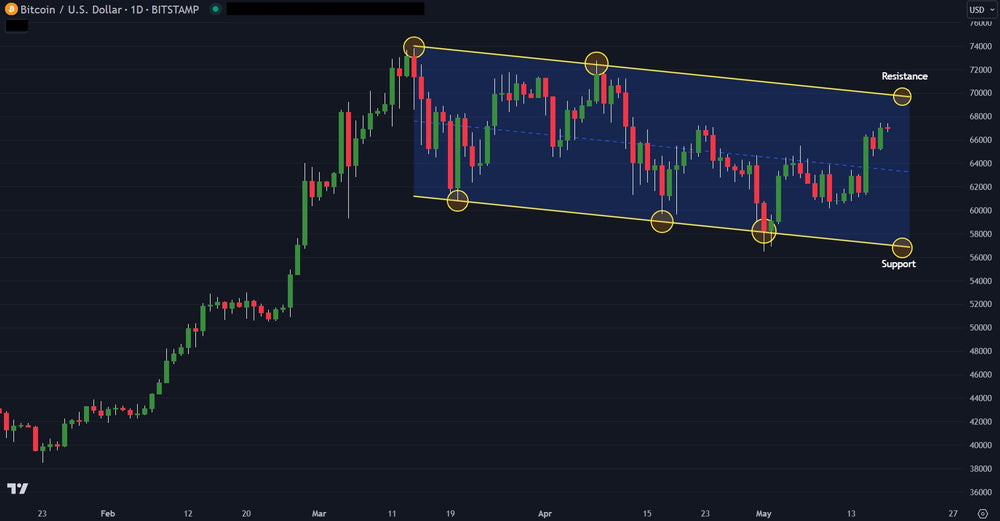
Bitcoin continues to chop inside a parallel channel. After hitting nearly $74,000, Bitcoin has been digesting the move and bouncing between that all-time high and the mid $57,000 range.
From a purely technical chart analysis perspective, the Bitcoin channel is bullish. It shows Bitcoin is consolidating sideways to lower after the monster rally that took Bitcoin from the $15,000 range to its all-time high of $74,000.
Traders will be watching the high end of the channel, around $69,000. That is the breakout level that sends Bitcoin to $74,000 again, and likely much higher.
However, should Bitcoin break below the channel, the $57,000 level, downside may be switch and take it quickly to $50,000.
The key risk for Bitcoin remains the risk asset market. Should the stock market ever have a sharp pull back of 10% or greater, Bitcoin would likely sell sharply, as much as 20-25%.
The long-term narrative remains fully intact regardless of near-term up or down moves. The more printing of money, the more valuable Bitcoin likely becomes.
Trading involves substantial risk. All content is for educational purposes only and should not be considered financial advice or recommendations to buy or sell any asset. Read full terms of service.


