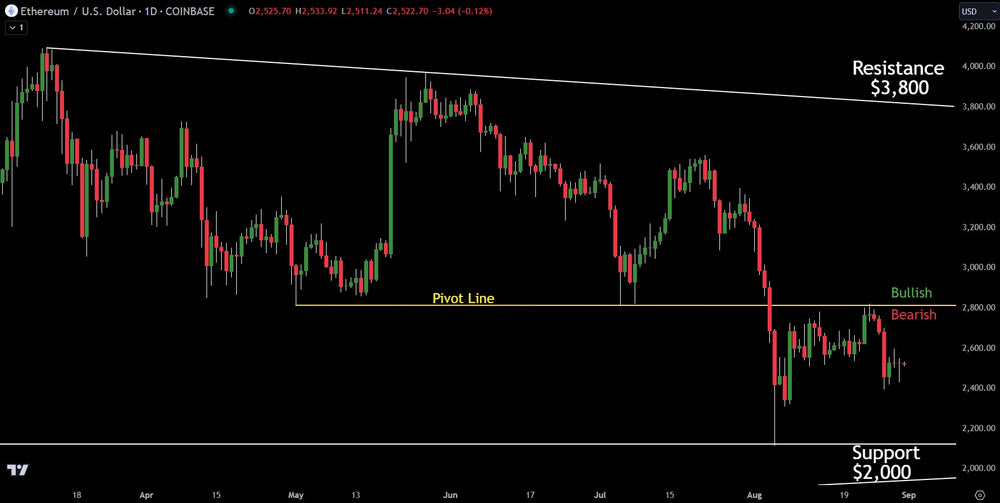
Weekly Technical Analysis On Ethereum

A week ago, Ethereum attempted to push into and above the pivot line. The pivot line is the bullish and bearish line seen in the chart above. Below the line, price action favors downside while above, it favors the upside. Ethereum failed to get above the pivot line.
Based on the probability of technical analysis, this meant Ethereum still had a bearish bias. Sure enough, the failure of Ethereum to push above the pivot line resulted in a flush to the downside.
Based on the price action and probability, Ethereum is favoring a move lower to major support at $2,000.
Should Ethereum push up and confirm above the pivot line, it would take on a strong bullish bias with an upside resistance of $3,800.
Verified Investing gives investors pure data and chart analysis with no bias. The charts and data are all that matter as they help predict the probability of the next move. Too many investors rely on the media or social media. These avenues have bias and trigger emotion. This causes investors to make the wrong decision and often lose money. Learn to trade and invest by focussing purely on the data and charts.
Trading involves substantial risk. All content is for educational purposes only and should not be considered financial advice or recommendations to buy or sell any asset. Read full terms of service.


