Weekly Technical Analysis On The Bitcoin Chart
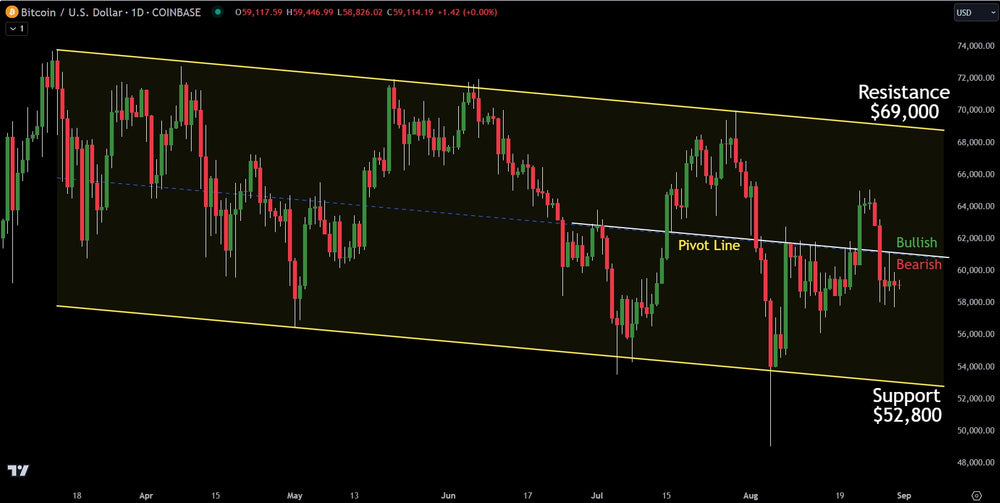
Over the last week, cryptocurrency Bitcoin was above the pivot line but failed to confirm. This meant probability never swung to bullish even though price was above the pivot line. The pivot line is the bullish or bearish line per probability, once confirmed. A confirmed move above signals a likely further increase in price while a confirmed move below strongly favors further downside.
Unable to confirm above, Bitcoin collapsed back below the pivot line and dropped as low as $57,800 before recovering slightly. With Bitcoin solidly below the pivot line, probability favors the downside with major support at $52,800, then $49,000.
Should Bitcoin rally back above the pivot line and confirm, upside would likely take Bitcoin back to $69,000, then $74,000.
Verified Investing is committed to being the one source for investors that has no bias or narrative. The goal is to give investors purely data and chart based analysis where probability is all that matters. This allows for clear thinking and unemotional decision making. This is how the best traders and investors in the world make money consistantly.
This article is intended for informational and educational purposes only and does not constitute financial advice. All trading involves risk. Past performance is not indicative of future results.
Trading involves substantial risk. All content is for educational purposes only and should not be considered financial advice or recommendations to buy or sell any asset. Read full terms of service.